Appendix D: Successive Probability Nomograms for Shannon
Shannon, whom you met in Chapter 12, was suspected of having ADHD. Lakisha Washington, her school psychologist, collected information that enabled completion of a series of probability nomograms. These are depicted in the four figures that follow. Note, however, that the school psychologist could have completed stages on a single form by using different color markers, such as those used in subsequent nomograms depicted here. She could have also conducted a simple calculation adding each price of information to derive a composite Likelihood Ratio. In Figure AC.1 Lakisha enters the pretest probability for ADHD in her practice venue (.15). She updates Shannon’s prospects of ADHD based on the presence of Tourette syndrome (a risk ratio of 5.2 as found in Table 4.13 in Chapter 4). The resulting posttest probability is approximately .50.
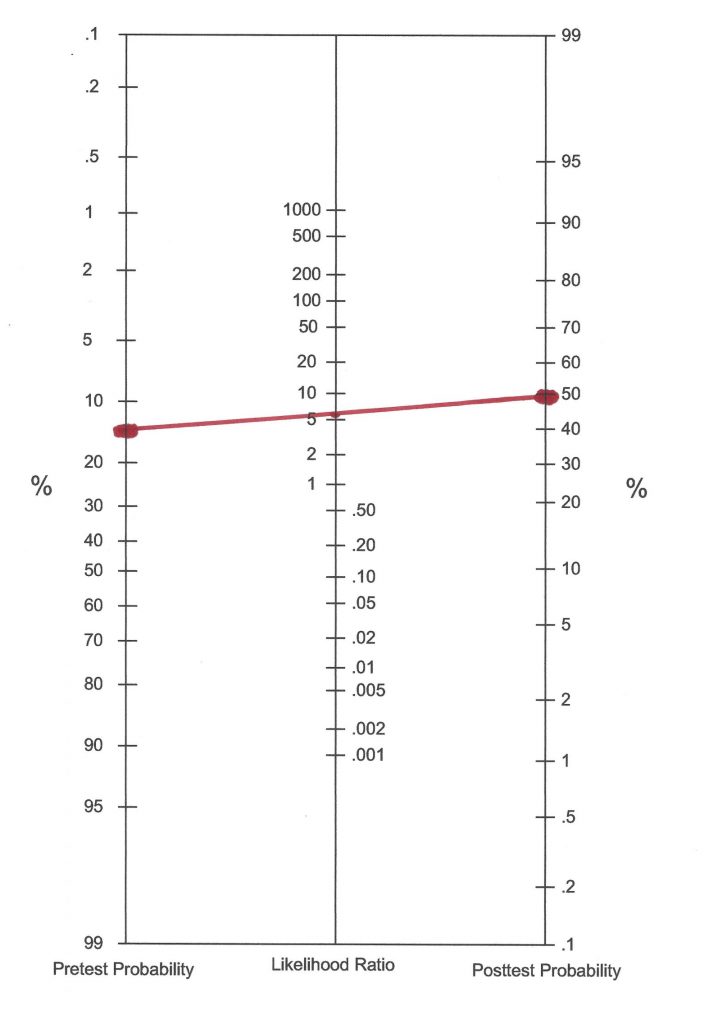
In Figure AC.2 Lakisha goes through the step of updating probability based on a classroom observation. The observation was judged to reveal nothing either suggestive nor dismissive of ADHD. Lakisha uses a relative risk of 1.0 based on this inconclusive observation. The current pretest probability (before observation) of .50 thus remains unchanged after observation. Classroom observations are covered in Chapter 8.
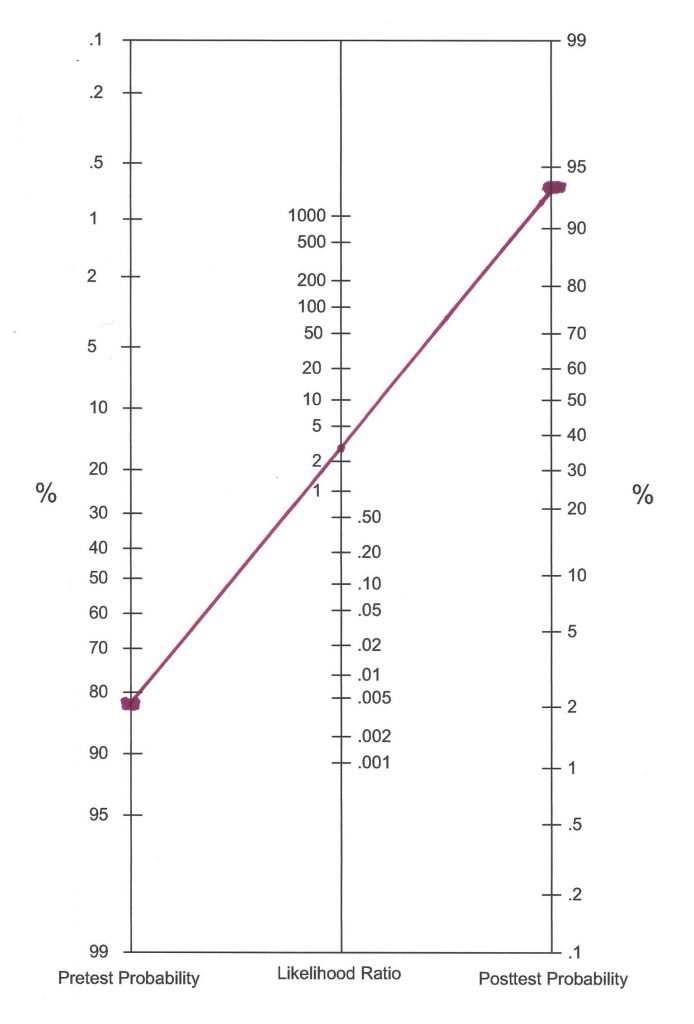
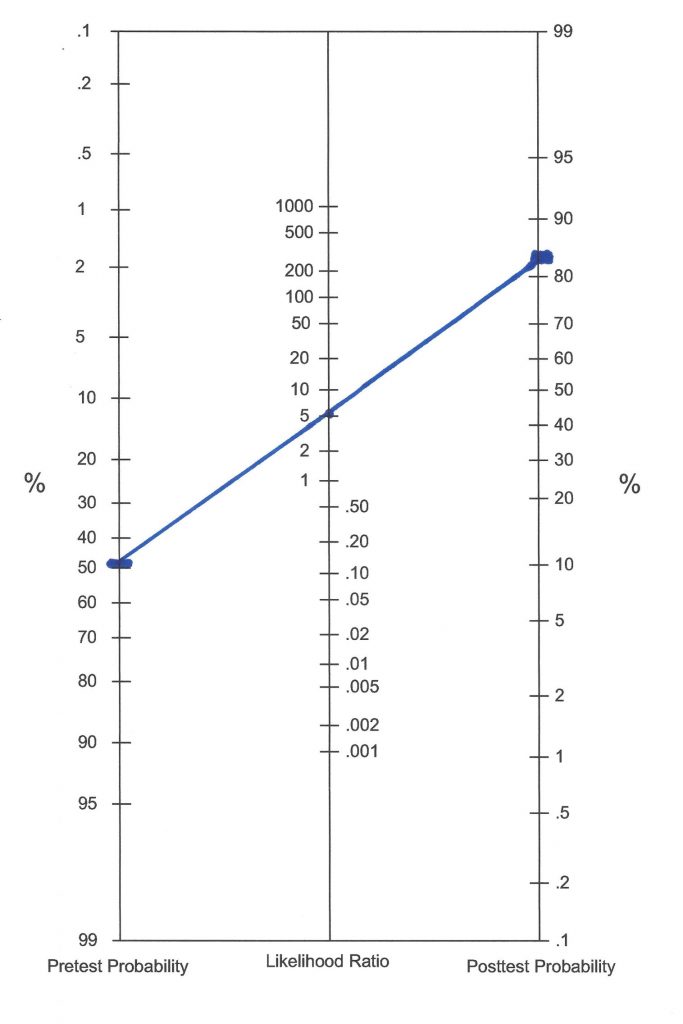
In Figure AC.3 Lakisha again updates, this time based on Conners scores regarding ADHD provided by parents. The posttest probability from Figure AC.2 is carried over to become the pretest probability in Figure AC.3. Because there was a positive score, she enters the DLR of 5.2 in the middle column (This value can be found in Table 5.10 in Chapter 5). The updated posttest probability is now greater than .80.
In Figure AC.4 the new pretest probability of roughly .83 is entered into the nomogram as is the results of other information. This time it positive Conners scores from a teacher of 2.9. The final posttest probability is between .90 and .95. It is quite likely the Shannon has ADHD (more than 90% chance). It is quite unlikely that she does not have ADHD (roughly less than 10% chance).