
5 Broadband Rating Scales
Key takeaways for this chapter…
- There are now many parent- and teacher-completed rating scales (e.g., Behavior Assessment System for Children-3; Conners Comprehensive Behavior Rating Scale)
- Each of these offers scores on many social-emotional dimensions (e.g. anxiety, inattention) plus composite scores, all with the expenditure of minimal professional time and effort
- Favorably, most of these scales have large, representative standardization samples as well as evidence of acceptable reliability (and at least some validity research)
- Less favorably, not every individual dimension (e.g., social communication) has been researched, and some test manuals fail to provide sensitivity and specificity statistics
- Although manuals generally describe how to interpret their scores, most fail to indicate how to synthesize scores with background facts or with other assessment information (e.g., narrowband scales, interviews)
- For many referral questions, broadband rating scales help facilitate use of the HR approach, probability nomograms, and checklists
Cases/vignettes in this chapter include…
- Clayton, questions about the validity of ratings
- Dr. Maritza, forced to used broadband scales
- Patrick, selecting broadband scales to round out an assessment
- Novella, remembering to follow the steps in interpretation
Now comes a critically important chapter. It is necessarily a bit longer. Please read and reflect. Broadband rating scales have achieved the highest usage rates of among all of school psychology’s assessment techniques used. To be specific, the BASC-3 parent version and teacher version, respectively, garnered the very highest ranking and nearly the highest among 150 assessment techniques (Benson, Floyd, Kranzler, Ekert, Fefer & Morgan, 2019). It’s hard to envision a contemporary school psychologist who finds no use for the broadband scales. In reality, most school psychologists’ offices include one or more popular scales resting on a desk or in a file cabinet. Broadband scales prove integral to many school-based social-emotional assessments, and they are often applied even when a referral question is initially unrelated to social-emotional concerns (e.g., routine SLD-oriented evaluations). But this book’s coverage of broadband scales requires a warning–you are cautioned against using these tools without first accessing their technical manuals. There are things you need to study among the 372 pages of the Conners Comprehensive Behavior Rating Scale (Conners, 2010). The same is true regarding the BASC-3’s 442-page manual (Reynolds & Kamphaus, 2015).
Similarly, this chapter is a mere introduction to broadband rating scales. And, to be clear, the chapter is not about selecting the best rating scale. Its pages are not designed to offer a scholarly review of the pluses and minuses of popular scales. If you wish to examine candidate rating scales side-by-side before selecting the best you should find reviews at online sources such as the Buros Center for Testing (https://buros.org) or texts such as Frick, Barry and Kamphaus (2020). These sources include important facts about topics like: age range, reading level, administration time, quality of norm sample, quality of reliability, and quality of conventional validity evidence. As you have already seen, conventional reliability and validity are necessary but not sufficient for some inferences that school psychologists make, especially about classification. Each of these scales provides vast information about its reliability and validity characteristics. Thus, those considering adoption of the BASC-3 should review the 55 pages concerning reliability and validity of the BASC-3 teacher version as well as the 50 pages concerning reliability and validity of the BASC-3 parent version. In these sections of the BASC-3 manual, one can find information about reliability (i.e., internal consistency, test-retest, inter-rater) as well as validity related to factor structure (factor analysis) and criterion (e.g., correlations with Conners CBRS, Autism Spectrum Rating Scale, Delis Ratings of Executive Functions, etc.). Similar, but not identical, reliability and validity information is available in the manuals of other broadband rating scales. In this chapter, we concentrate on application. Consequently, the topic of classification validity receives special attention, as you will see below.
With that notification out of the way, just what is the nature and make-up of this class of assessment tools? And how are they used in practice? These scales are called broadband because they assess many dimensions of social-emotional functioning. They are lengthy, with up to 500 objective items. Each item is read and rated by an informant, such as a teacher or a parent. For example, an item found on a scale for teachers might read as follows: “Student fails to pay attention.” Concerning this item, a teacher would select from four choices on a Likert-type scale: “always true,” “usually true,” “sometimes true,” “never true.” Raw score values would then be assigned to items, perhaps as follows:
- Always true = 3 points
- Often true = 2 points
- Sometimes true = 1 point
- Never true = 0 points
When many other items are included in the same scale (perhaps a scale entitled “Inattention”), then raw scores are tallied across items. For example, the Inattention scale, as part of a broadband rating instrument, might comprise 15 items, each scored on this zero-to-three continuum. The result would be raw scores ranging from 0 to 45 on the Inattention scale. By accessing age-specific and gender-specific norm tables found in the test manual, an Inattention standard score could be generated from the aggregated raw score.
Critically, broadband scales are generally organized hierarchically: relatively few composite scores (e.g., concerning internalizing problems or externalizing problems) are made up of constituent, fine-grained scales tapping dimensions like anxiety and depression or conduct problems and hyperactivity. The broadband scales also do more than just measure dimensions related to classic psychopathology; they can screen for delays in adaptive functioning or communication problems. As you may suspect, broadband scales also garner popularity for their ability to collect a lot of information with little effort. Importantly, they sometimes capture low-frequency behavior that may otherwise elude an observer whose classroom visits are necessarily time limited (Volpe, Briesch & Gadow, 2011). Given these facts, one can begin to envision the practical uses of broadband rating scales.
Other reasons also contribute to the appeal of these instruments. In their contemporary versions, many broadband instruments boast outstanding normative bases (large and highly-refined national samples), sophisticated factor analytic evidence, clearly-reported findings regarding reliability and validity (especially correlations showing convergence with other social-emotional scales). You will find some of these considerations are covered briefly at an instrument-specific level in this chapter. The same is true when narrowband scales are covered in Chapter 7, as well as for ADHD-related tools in Chapter 11 and autism-related tools in Chapter 12. Critically, however, this book concerns the process of social-emotional assessment. As such, it is not a text on social-emotional psychometric instruments.
Because this is the first chapter that includes psychometric tests, it’s important to put their use in context. Tests are used to answer questions. They help resolve unresolved hypotheses. They are not (or should not be) administered in evaluations merely pro forma, with no clear purpose in mind. The Reflective System of thinking should be in place before broadband scale use. Regarding the potential purpose for broadband use, sometimes it is clear, such as when the referral agent and the school psychologist agree on one of the questions found in Table 3.1. Please return to that table now and follow along with the points discussed below. It is obvious that one or more rating scales can help address several of the listed referral questions. Tests, supported by norms and concerned with classic test theory notions like reliability, are inherently nomothetic (McLeod, Jensen-Doss & Ollendick, 2013). They compare one student’s score(s) with many other students’ scores, hence enlightening the status of the one student by virtue of what is already known about many students. By the end of this chapter you will see that broadband scales are often helpful regarding referral questions 7, 8, 10, 11, 12, and 13, which are essentially nomothetic (and sometimes categorical). That is, popular broadband scales are especially qualified to speak to the prospect of recognizable social-emotional conditions (and mental health diagnoses) and to help establish severity. This information can also aid in establishing eligibility for special education services by helping you complete a checklist concerning necessary criteria. Importantly, because they systematically measure students across multiple domains of social-emotional functioning, broadband scales may be able to help establish which among many possible problems is most compelling. Broadband scales, of course, can also help confirm that no problems exist. And, because social-emotional problems often appear across multiple domains in the same individual, broadband scales can also address the issue of comorbidity. For example, scales like the BASC-3 can estimate whether any noteworthy social-emotional problem exists, its general nature (perhaps more internalizing than externalizing), and its fine-grained appearance (perhaps more indicative of anxiety than depression). You will see later that referral questions 3 and 9 in Table 3.1, universal screening (Renshaw et al., 2009) and progress monitoring (Busse, McGill & Kennedy, 2015), may also benefit from the use of broadband scales (or tailored variations of them). These topics are covered in Chapter 15. But if you think about the requirements associated with referral questions 1, 2, 4, and 5, rating scales may not be especially helpful. These are largely idiographic, not nomothetic, questions that concern the particulars of an individual’s life and her personality (Phillips, 2005). Consequently, other techniques are needed to adequately address these questions (e.g., clinical interview, behavioral observation, review of background information). This discussion reminds you to stop and think as you plan each student’s assessment. Similarly, don’t expect that broadband rating scales satisfy every requirement concerning social-emotional assessment.
A Few Things to Remember about All Behavioral Rating Scales
School psychologists are blessed with access to an array of rating scales. Few would quibble with the contributions of commercially available broadband rating scales to school-based practice. That said, this entire class of instruments needs to be considered in the light of harsh reality. Here are a few general things to consider before we look individually at several popular broadband instruments. Most of these pluses and minuses are equally applicable to narrow-band measures, the topic in the next chapter. For students who have not enrolled in a course on measurement principles, some of this information is likely to be especially relevant. There are also several helpful texts on mental measurement and psychological testing generally that you might want to access (e.g., Bandalos, 2018; Cohen & Swerdlik, 2018).
Objective, But Only up to a Point
Rating scales, of course, are comprised of perfectly uniform items. Importantly, every informant reads exactly the same items, in precisely the same order, following just the same directions. Items are forced choice; respondents select from among finite (objective) choices. These impressive objective hallmarks, however, should not disguise the inescapable subjectivity inherent in each item’s completion. Informants’ worldviews, their prior personal experiences, and the subjective meaning that they ascribe to items’ wording help drive which response options they ultimately select. This topic was addressed for school psychologists more than 25 years ago in an article with a wonderful title, “How many fidgets in a pretty much: A critique of behavior rating scales for identifying students with ADHD” (Reid & Maag, 1994). The essence of their argument is captured in the following passage. “The problems ….can be depicted by the example of ‘fidgets.’ Many instruments require a teacher or other adult to rate the extent to which the target child fidgets. Behavior rating scales, however, fail to operationally define what behaviors constitute a fidget, lack information indicating that fidget behaviors can be accurately captured, and, most importantly, provide no common metric for the scaling of the magnitude or intensity of fidget behavior. Thus, two separate raters could observe the same behavior and produce ratings that differ as to the presence or absence and frequency or intensity with the difference between ratings being due to factors internal to the raters rather than the child’s actual behavior” (Reid & Maag, 1994, p. 347). According to classical test theory, subjectivity-related differences due to the rater rather than the child being rated represent sources of measurement “error.” They help to contribute to low scale reliability. In the nomothetic world, and in the realm of classical test theory, low reliability is a problem. And indeed, the scores that arise from many behavior rating scales possess poor inter-rater reliability. These facts suggest caution regarding broadband scores. The cold, hard numbers you witness on a student’s broadband profile necessarily originated in the subjective world of a human rater.
Norm-referenced
Why are behavioral rating scales so enormously popular? One reason almost certainly is their norm-referenced feature. Norms permit a single individual’s score to be compared to scores of many individuals. This is the essence of the nomothetic perspective. The key is to access a representative sample so that score interpretations are accurate (Bandalos, 2018). For example, a 9-year-old student seems to be aggressive, and it would be possible to examine what an informant, such as a teacher, indicates about this possibility. Of course, this student’s level of aggressiveness might be scrutinized with or without accessing information about other 9-year-olds. Questions about aggressive actions might be posed orally or prepared in written form. Examples might include “bullies others,” “hits or pushes when angry,” and “shouts at classmates.” Even without norms to contextualize teachers’ responses, it is possible for a diagnostician to offer an estimate about this youngster’s level of aggressiveness, but there is no escaping the imprecision inherent in the process. As even novice school psychology students recognize, however, norms with which individual’s scores can be compared offer advantages. With norms, it becomes possible to judge whether a teacher’s level of item endorsement for a boy this age is common or uncommon, and to quantify the rarity of any outlier score. As you will see, with norm-referenced scores (such as T-scores with a mean of 50 and a standard deviation of 10) diagnosticians find themselves armed with context enriched numbers.
Like popular counterparts that measure cognitive ability and achievement (e.g., WISC-5; Wechsler, Railford & Holdnack, 2014; Kaufman Tests of Educational Achievement-3, Kaufman & Kaufman, 2014), many broadband rating scales possess sophisticated norms. The Conners CBRS Teacher, as one example, was standardized on 2,364 representative youth (Conners, 2010). Both males and females were recruited across the age spectrum from 6 to 18 years. Besides gender and age, the dimensions of race/ethnicity, parental education level, and geographic location were analyzed to assure representativeness. Other rating scales boast comparable norm groups (see Table 5.1).
Sometimes, however, publishing companies intentionally seek non-representative samples, such as those comprised of youth with various recognizable conditions. These resulting so-called “clinical norms” offer a complement to standard (representative) norms. For example, BASC-3 users can access norms for students with ADHD, emotional/behavior disorders (EBD), ASD, Developmental Delay/Disorders, and SLD. School psychologists, of course, must carefully distinguish between general scores (i.e., those associated with a representative sample) from clinical-sample scores (i.e., those associated with specialized groups, such as youth with ADHD). A clinical group T-score of 50 (such as from a sample of students with EBD) indicates something quite different from a T-score of 50 associated with a general representative sample. The former, especially when coupled with a clinical range score derived from standard norms, suggests that the student’s score is both elevated and similar to a typical student with EBD. The latter, in contrast, suggests an unremarkable score.
Table 5.1 Broadband (Parent) Rating Scales and Their Standardization Samples |
|||
|
Rating scale name |
Standardization sample size |
Stratified with multiple census dimensions |
Additional clinical samples collected |
| Conners CBRS |
2,364 |
Yes |
Yes |
| BASC-3 |
1,800 |
Yes |
Yes |
| CBCL |
1,753 |
Yes |
No |
| Devereux |
3,152 |
Yes |
Yes |
Automated Scoring and Computer Printouts
The old days of hand-scoring broadband rating scales have largely disappeared. Nonetheless, some school psychology trainers still insist that their graduate students hand-score at least a few rating scales to gain a sense of the process and to see which items funnel into which scales. After graduate school, however, most school psychologists routinely use online scoring of BASC-3 and Conners CBRS, for example. Alternatively, scoring software can be purchased and downloaded on to one or a group of linked PCs, providing users the same technical advantages as online services. Besides time savings, automated scoring enables vast printouts (or online reading) of scores, interpretation and even explanatory/descriptive narratives. For example, a recently reviewed BASC-3 TRS printout comprised 37 pages, a Conners CBRS parent printout 41 pages. Included in printouts are things like scores, tables, symptom checklists, lists of items (including the exact wording of each), plus narratives for professionals to use (in report preparation) and even feedback handouts for parents. This degree of complexity represents a game changer when set against a mere page or two of scores (plus one or two graphic profiles) routinely available to broadband users 30 years ago. Every contemporary school psychologist will need to familiarize herself with the organization and content of the automated material associated with her preferred rating scales.
Informants Sometimes Produce Invalid Ratings
An individual’s rating scale scores may prove untrustworthy. For practicing school psychologists it does not matter whether this is considered a threat to “validity” (i.e., a test fails to measure what it says it measures; Frick, Barry & Kamphaus, 2020) or to “credibility” (i.e., reflecting a particular respondent’s bias or distortion; Youngstrom, Youngstrom, Freeman, de los Reyes, Feeny & Findling, 2011). Either conceptualization means that sometimes straightforward rating scale interpretation is rendered impossible. Favorably, both the BASC-3 and Conners CBRS are geared up to deal with distorted responses. Distortions may be conscious or unconscious, intended or unintended. They sometimes operate to exaggerate the severity of a child’s problems, whereas at other times to minimize them. As Table 5.2 illustrates, the BASC-3 contains five methods for ascertaining validity and response set. Validity scales like these were originally developed as part of personality inventories (e.g., the renown Minnesota Multiphasic Personality Inventory) rather than those of an informant.
In the broadband scales you will see in this chapter, validity scales rely more on logic than empirical research. This means that it is not entirely clear how well they actually detect parents’ or teachers’ careless responding or their distortions. Furthermore, the validity scales may not possess sufficient reliability to accomplish their intended purpose. For example, parents’ validity scale scores reported in the Conners CBRS manual are not particularly favorable. In fact, the standard error of measurement (SEM) for the Conners CBRS Positive Impression T-score is a sizable 6.32; 6.00 for Negative Impression (averaged across age levels). Confidence intervals associated with values this large would create very substantial ranges of uncertainty surrounding a validity scale (approaching 12 T-score points). Thus, an observed Conners CBRS T-score of 59, on its face an average range score, could be associated with a true score in the elevated range (T-score > 70) if a 95% confidence interval were adopted. This leaves school psychologists with challenges in interpreting validity scale scores. If the concept of SEM is unfamiliar to you, then you need to examine the texts cited above (Bandalos, 2018; Cohen & Swerdlik, 2018) or find a credible online source.
Table 5.2 BASC-3 Validity and Response Set Indexes |
|
|
Name of Scale |
Intent |
| F index | To detect excessive negative ratings: “fake bad” |
| L index (self-report versions only) | To detect excessive positive ratings: “fake good” |
| V index (self-report versions only) | To detect basic validity—to check for endorsement of non-sensical items |
| Consistency index (Q-global scoring option only) | Check on reliability of responses (do similar items receive similar endorsement?) |
| Response Pattern index | Check on careless responding (a rated item agrees with immediately preceding item) |
Let’s see in the real world how “fake good” tendencies and “fake bad” tendencies might come into play. Consider the situation with Clayton. Clayton is now in the third grade, and the preceding three school years have been difficult for him. He has consistently struggled to complete work and to follow classroom rules. Clayton has three brothers, two of whom have diagnoses of ADHD and are treated with stimulant medications. His father was diagnosed with ADHD as a child; he is now bitterly opposed to the use of psychoactive medication and dubious of the entire notion of ADHD. Clayton had a psychoeducational evaluation completed in second grade that documented the presence of a specific learning disability in reading. But social-emotional issues were largely ignored. The local school district’s philosophy is one of PBIS and RTI. In fact, Clayton’s second-grade evaluation consisted of just academic testing (no cognitive or social-emotional measures). By midway through second grade, Clayton was receiving resource special education services. Now, as a third grader, he is undergoing an additional assessment at the insistence of his mother who wonders if her son may have a social-emotional disorder, especially ADHD. Although Clayton’s mother seeks an evaluation, she already suspects that he has ADHD. Moreover, she’s convinced that stimulant medications would improve his behavior and propel school success. Interestingly, Clayton’s third grade teacher is a notorious naysayer regarding all things mental health in general, and regarding ADHD in particular. Both parents completed their own Conners CBRS independently. As did Clayton’s classroom teacher. The profile coming from mother’s Conners CBRS was compatible with ADHD. But there was no evidence of ADHD from either father’s or teacher’s rating scales. Even without scrutinizing the Conners CBRS’s validity indicators, there is reason to question these scores. Perhaps, with or without conscious awareness, Clayton’s father and his teacher have slanted their responses toward the positive on every item that seemed ADHD related. The exact opposite might have been true of Clayton’s mother. School psychologists, of course, should look at validity scale scores for all three informants. But they should also use common sense to help them place these three sets of ratings in the context of trustworthiness.
Parents’ personal mental health problems may also matter. A depressed mother or father may be incapable of rendering a fully accurate (valid) rating of a child. For example, research demonstrates that parents with depression disproportionately engage in “disrupted parenting,” such as neglecting to attend to their children’s behavior or remaining ignorant of events in their lives (Reising et al, 2013). How could a parent fairly rate his child about whom he may know relatively little? Similarly, there are a few parents who experience pathologically obsessive preoccupation with their child’s perceived flaws. This is confirmed to be true among some parents themselves suffering from OCD (Doron, Derby & Szepsenwol, 2017). This phenomenon has been described as “relationship OCD,” a consideration likely to contribute to distorted parental ratings. Professional circumspection is clearly in order. The foregoing nothwithstanding, Youngstrom and colleagues (2011) argue that diagnosticians should be cognizant of all informants’ credibility on the one hand and slow to simply summarily dismiss such ratings on the other hand. This is because research by these authors implies outright elimination of ratings from potentially inaccurate sources may actually constitute an overcorrection that decreases, rather than boosts, diagnostic accuracy.
Rating scale scores might also be invalidated because of cultural and linguistic factors, especially those related to parent informants. It is certainly helpful that both the BASC-3 and Conners CBRS scales offer Spanish language versions of their parent forms. And the ASEBA Child Behavior Checklist has been translated into more than 100 languages, everything from Afrikaans to Zulu. But considering just Spanish, it is impossible to assume equivalence of concepts and vocabulary between the base English and subsequently-developed Spanish versions. This is true even when standard forward and backward translation are used. What’s more, even if a Spanish translation were perfectly executed, the problem of valid parent ratings would hardly be solved. For example, are psychological concepts (e.g., sad mood, behavioral noncompliance) equivalent across diverse immigrant communities (or subsequent generations holding comparable values)? Research shows that practitioners approaching emotional disability assessments among English Language Learners paid scant attention to parents’ level of acculturation as part of the evaluation process (Ochoa, Riccio, Jimenez, Garcia de Alba & Sines, 2004). Unfortunately, questions about equitable and clinically-reasonable management of cultural and linguistic considerations, like those concerning the general risk of invalid ratings, appear to lack simple answers. Again, circumspection and caution seem to be needed.
Situational Demands Influence Ratings
Recall the case of Franklin from Chapter 2. This young man appeared to be suffering distress during two classes but not during several others. The problems appeared to be superimposed on a shy temperamental style. Franklin’s case was pulled together without the use of rating scales, although scales could have been easily used. How might stakeholders’ rating scales looked if they had been used? It’s probable that social-emotional scores coming from those classrooms that Franklin avoided (where he was distressed) would look different from those classrooms he never avoided (where he apparently was not distressed). Similarly, is it plausible that ratings coming from Franklin’s parents would match those coming from school? Probably not. This is so because parents had long seen their son as temperamentally shy but apparently had never seen him as frankly unhappy.
This illustrates an important potential consideration—behavioral ratings can diverge simply because students’ behavior sometimes differs from one setting to another. This is wholly expected when an idiographic perspective is adopted. From this perspective, scores need not be about a fixed trait alone (as they are from the nomothetic perspective and according to classical test theory) but also about a student’s unique set of school situations and the vast ways that they may influence his presentation (Frick, Barry & Kamphaus, 2020). Such a view of score differences is particularly relevant when ADHD is a possibility. For example, classrooms, which typically require focus and persistence to complete work, are often inherently more demanding than relatively free-play environments that sometimes exist at home, which may demand little focus and no task completion (Hartman, Rhee, Wilcutt & Pennington, 2007). Few school psychologists should be surprised, then, when informants in the first setting rate a child as evidencing greater attention problems than informants in the second setting.
In fact, the intuitive idea of less-than-perfect concordance among raters is documented in actual data sets. For two teachers rating the very same student on the Conners CBRS Conduct Disorder scale, for example, the inter-rater correlation was just .40 (Conners, 2010); the inter-rater correlation between two parents’ ratings regarding Conduct Disorders was .53 (Conners, 2010, see p. 159 and p. 160). Similarly, two teachers rating a child on the BASC-3 produced these representative correlation values: Anxiety r = .35; Aggression r = .56 (for school-age children; see Reynolds & Kamphaus, 2015, p. 127). Correlations between school-based and home-based informants are, of course, more modest (e.g., BASC-3 child, Anxiety r = .29, Aggression r= .37; Reynolds & Kamphaus, p. 228). When scores disagree across raters, the source may reflect legitimate differences in expectations and demands. But some of the disagreement may also reflect lack of reliability on the part of each independent rater.
Whatever the source, unfortunately, divergent scores represent a challenge for interpretation. Fortunately, sometimes discrepant scores represent important diagnostic clues. In Franklin’s case, for example, had clinical range scores from certain teachers appeared in the presence of average-range scores from other teachers then some hypotheses would have been strengthened, others weakened. Specifically, hypotheses regarding situational explanations (rather than invariant student characteristics) would have seemed more compelling. At any rate, readers are encouraged to examine the manuals of the instruments that they intend to use. This includes checking for themselves inter-rater reliability values. They are also cautioned about taking any rating scale score as an indication of a static trait that ought to appear identically (or nearly-identically) across situations.
Critical Items Serve as Red Flags
Most broadband scales offer diagnosticians a few especially relevant (critical) items to consider. The BASC-3, for example, specifies that endorsement of any of its critical items “suggest(s) danger to the well-being of the child or others” (Reynolds & Kamphaus, 2015, p. 62). Practically speaking, unusual endorsement of any critical item warrants follow-up inquiry. It’s easy to recognize why threats to hurt others or expressions of a wish to be dead are critically important. Consequently, regardless of a particular case’s referral question, it makes sense to conduct a check to make sure no critical items were endorsed (Note that the HR Worksheet [see Chapter 2] includes a requirement that you checkoff having examined critical items). The BASC-3 printout facilitates the process—critical items that are strongly endorsed appear in bold font. In parallel, critical items with unusual endorsement on the Conners CBRS are literally denoted by a red flag on the printout, easily grabbing school psychologists’ attention.

Linkage to DSM-5 Symptoms
When school psychologists view a student relative to DSM-5 criteria, broadband scales can help. That is, for school psychologists approaching a formal DSM-5 diagnosis, popular tools (e.g., BASC-3 and Conner CBRS) provide several DSM-related symptom scales. Relatedly, there are printouts that list teachers’ and parents’ level of endorsement of each DSM symptom concerning several child-specific diagnoses (e.g., ADHD, autism spectrum disorder). Caution is required, however. This is because the precise wording of rating scale items and that of DSM-5 rarely match. This fact means that parents and teachers would need to be interviewed before all criteria necessary for a DSM-5 diagnosis could be satisfied. Still, a printout might speed the symptom confirmation process. The topic of categorical decisions, including use of broadband scales to support the process, will be revisited in Chapters 11 (regarding autism) and 12 (regarding ADHD).
Just What is Being Measured?
One challenge is common to every rating scale seen in this book. That is the critical question of whether test descriptions match test content (i.e., content validity). Take anxiety as an example. Anxiety is obviously multifaceted–it might encompass several things: some subjective and covert (e.g., worry and apprehension) and some objective and overt (e.g., physical signs such as sweaty palms and a racing heart). Consequently, when broadband rating scales include an anxiety index, that index should be comprised of items concerning both of these aspects of anxiety. When a test does this (i.e., when it captures all aspects of a construct) it is said to enjoy full construct representation (American Educational Research Association [AERA] et al., 2014). When it fails to do so, it is guilty of construct underrepresentation. To achieve full construct representation, it is only logical that one should know precisely what the construct is made up of. This would depend on a definition of the construct and a sense of boundaries of that construct (e.g., what is included in the notion of anxiety and what is excluded, according to the authors notion [theory] of anxiety). Thus, a good definition is essential, even if only sometimes provided explicitly. Deborah Bandalos, in her text on measurement, warns “many researchers [or test developers] gloss over this step, feeling, perhaps, that the definition of the construct being measured is self-evident. Nothing could be further from the truth, however” (Bandalos, 2018, p. 43).
When you examine test manuals of broadband rating scales ask yourself whether the tests’ authors defined their constructs. Also, ask if there are a sufficient number of items available to fully represent each construct. Sometimes the answers to one or both of these questions will be no. This bears on the confidence you can afford scores in your practice. Behavioral rating scales like the BASC-3, for example, certainly list the items that make up each of their clinical scales. And there are descriptions of scales to aid score interpretation, but the BASC-3 manual seems to fall short of a precise definition of its constructs. Furthermore, relatively few items make up some BASC-3 clinical scales. For example, the BASC-3 includes an adaptive scale entitled Leadership. This scale is made up of just 9 items. When school psychologists interpret the Leadership scale, they are encouraged to ask themselves whether these 9 items adequately capture the notion of leadership.
There is a problem related to, but distinct from, construct underrepresentation. This problem concerns construct irrelevant variance (AERA et al., 2014). Construct irrelevant variance concerns inadvertently measuring aspects unrelated to the construct under consideration. In other words, construct irrelevant variance has to do with including items that don’t belong rather than insufficient items that do belong. Again, consider the BASC-3 Leadership scale. Of the 9 items in this scale, one item asks the rater if the child is creative. Is creativity part of Leadership? Your intuition may say no. Again, a solid definition of leadership would help. Of course, there is more to the process than examining individual items and their congruence to stated definitions. Statistical methods can help answer this question. Decrements in the correlation between a scale (e.g., BASC-3 Leadership) and other (well-established) measures of leadership upon introduction of a new (dubious) item signal psychometric evidence of construct irrelevant variance.
In part, the items that make-up various scales and indexes are guided statistically, not by mere human judgment. For example, test authors sometimes look at item placement via correlations between each individual item and an entire scale where they might fit (part-whole correlations). Relatedly, item placement can be guided by intercorrelations among various scales so as to find the best statistical matches between items and scales (factor analysis; DeVellis, 2012). Again, school psychologists are obliged to familiarize themselves with test manuals, including some general knowledge about the method and rationale for item formulation, placement and final item-level retention.
Stand-alone Test Interpretation Versus Comprehensive Assessments
It’s essential that the manuals of broadband rating scales indicate precisely how to use them in practice. Indeed, manuals often include an description for multi-step interpretation. Test users, for example, might be prompted to start by examining validity scores, then to consider one or two global mental health-scale scores before turning to a dozen or so finer-grained mental health-scale scores. High scores, of course, imply social-emotional problems, either categorically or dimensionally. Critically, however, manuals sometimes read as if diagnosticians are informed only test scores. In reality, this should never be the case. Stand-alone interpretation guided solely by a test manual’s script risks the WYSIATI heuristic (see Chapter 2). In other words, what you see about the child is what is found only (mostly) in her rating scale results—that’s all there is. But, in reality, as you have already learned, broadband scales are seldom used in isolation. As the cases you have seen so far reveal, these instruments are used to answer referral questions within the context of a school concern, rather than to describe a child in a vacuum. Depending on the question, the process of assessment evolves over time. It is not one of administering a test, looking at a profile, considering cut-scores, and then blindly describing a child. In other words, these tests are typically employed as part of a process like the one described as HR. Fortunately, in reading test manuals, you’ll see that there is at least implicit recognition of this reality. This book’s approach advocates (usually) employing test scores as part of a comprehensive process. You are obliged to read the manuals, but you were also obliged to practice in the best interest of the child. Remember the advice you heard earlier in this book: interpret the child, not the test. Accordingly, be cautious of stand-alone test interpretation.
Cultural-Linguistic Considerations and Broadband Scales
In Chapter 4 we addressed the importance of cultural and linguistic considerations when collecting background information. Thus, it’s hardly a surprise that these factors are also relevant in the current chapter regarding broadband rating scales. Two considerations merit attention: (1.) linguistic barriers to using broadband rating scales, and (2.) cultural barriers to using broadband rating scales.
Linguistic Barriers and Broadband Rating Scales
You were already urged (in Chapter 4) to routinely consider linguistic barriers while talking with parents. Specifically, it was argued that parents lacking English oral proficiency should prompt use of a trained interpreter. Following just the same logic, parents who cannot read English well (but who possess literacy in a foreign language) probably require a translated broadband rating scale. Happily, most popular scales provide Spanish language translations. Interestingly, scales used less often in schools, specifically the ASEBA Child Behavior Checklist (CBLC) and the Teacher Rating Form (TRF), both detailed later in this chapter, offer far more than just a singular Spanish option. In fact, the CBLC’s publisher (Achenbach System of Empirically Based Assessment; ASEBA) provides translations for more than 100 languages and dialects. This reality represents a bit of a paradox. The BASC-3’s teacher and parent completed options are the most popular of all rating scales. Yet the far less popular TRF and CBCL (16th and 17th most popular rating scales among school psychologists; Benson, Kranzler, Floyd, Eckert. Fifer & Morgan, 2018) afford many more options for practice in a rapidly evolving multicultural country.
The challenges associated with producing a credible translation are worth brief contemplation. One challenge is to create a version that matches the content of the standard English version. In other words, each item in a standard English version rating scale must be faithfully translated into another language, such as Spanish. As many readers know, there is an accepted methodology for such translations. The first step is to translate each item into the target language. Although this straightforward first step might be intuited to render a trustworthy alternative version, things are not so simple. Each item in the translated version may or may not be construed by readers differently than the standard English items that spawned it. If items in a new (non-English) version are matched well, then there is said to be high translation fidelity (Bontempo, 1993). The conventional method to improve translation fidelity is back translation. The new (non-English) version is retranslated into English. This permits the original and back translated versions to be compared side-by-side. Faulty aspects of the translation can then be corrected, ultimately producing a non-English version with strong translation fidelity. Fortunately for our purposes, most popular broadband scales perform such a back-translation procedure for their parent-completed versions.
Another translation-related challenge involves language within the context of culture. Translators must possess expertise and knowledge about child development, behavior, and family life within the culture in question. This is true because translating rating scale items is not the same as translating a poem or a diplomatic document. Regarding the Conners CBRS, three Spanish speaking staff members at MHS (the publisher of this instrument) created three preliminary Spanish versions. MHS then used the services of an expert bilingual school psychologist, Dr. Sam Ortiz. Dr. Ortiz reviewed preliminary items for their readability, content, and cultural sensitivity regarding use in the United States. Two other Spanish-speaking school psychologists then back translated items into English. This permitted scrutiny and ultimate item revision via repeated iterations. This process rendered a final version of the Spanish Conners CBRS. Roughly comparable procedures were used regarding the BASC-3’s Spanish version for parents. In the case of the Spanish-version BASC-3, however, 10 bilingual professionals (from psychology and education) employed by Pearson (the publisher of this instrument) conducted the analysis for accuracy and bias. Like the Conners CBRS, the BASC-3 analysis sought to create a Spanish version for use with parents in the United States.
Cultural Barriers and Broadband Rating Scales
As you also saw in Chapter 4, language is one consideration, cultural attitudes and practices another. Sometimes parental language and culture overlap, but sometimes they dissociate. Thus, although it is true that French (or a French variant) is used many places (e.g., France, Belgium, Haiti, Canada, Congo), it is also true that inhabitants (and immigrants) from these countries harbor meaningful cultural distinctions. This implies that a French-language version of a rating scales (e.g., ASEBA-CBCL) maybe a good starting place, but it may represents a poor stopping place. This is so because it would be impossible for just one English-to-French translation to capture the array of nuanced culture and language considerations found in various French-speaking locations. The same is arguably true of any English-to-Spanish translation. As you will see below, the CBCL and Teacher Report Form (TRF) offer alternative norms enabled by samples collected in many countries using translated versions of the CBCL or TRF. The ASEBA website section entitled “Societies with Multicultural Norms” lists more than 50 such instances. https://aseba.org/societies/. Just a few are listed here.
- Brazil
- China
- Croatia
- Hong Kong
- Iran
- Israel
- Jamaica
- Kosovo
- Puerto Rico
- Taiwan
- Thailand
The idea is that a school psychologist might offer parents a foreign language CBLC that simultaneously provides her with multicultural norms to aid her interpretation. Of course, this would be applied to parents now residing in the United States who presumably once matched the demographics of these various non-U.S. norms. But the parents now reside in the United States and are consequently assumed to be reflected in the norms of the English CBLC. This constitutes a conundrum. A solution is to do two things. First, use both the standard U.S. as well as the specific multicultural norm. Resulting student profiles can be compared for agreement and disagreement, with priority of one profile over another judged against other information (such as found in the HR Worksheet). Moreover, multiple informants can rate the same youngster. Item level analysis is also positive. In an ideal world, an interpreter with detailed cultural knowledge might finally scrutinize the process for misunderstanding. Clearly caution is in order. Simply finding a rating scale whose items match the primary language of an informant may not suffice. Sensitivity to language and culture are required any time a student from the non-dominant culture is assessed.
A Few Popular Scales, Briefly Considered
We cover the organization and general features of four broadband teacher and parent scales. You have already seen that all such scales share features. Thus, individual comparisons of these universal dimensions are not included here. That said, for practical reasons we do address the topic of diagnostic utility statistics for each of the four scales. This coverage is important because diagnostic utility statistics provide a sense of how well the measures work for classification purposes (and the nomothetic perspective). Equally important, values indicated here might set the stage for applications in probability nomograms (see Chapter 2 for details on this methodology). Even without an in-depth review of broadband scales, the chapter offers some sobering facts. Some manuals are missing important information and/or seem to mischaracterize some of their capabilities. By the end of the chapter, your continued admiration for broadband rating scales should be tempered by the reality of what they can actually accomplish. You will see a similar perspective regarding personality inventories and self-report measures in Chapter 6 as well as regarding narrowband scales in Chapter 7.
Behavioral Assessment System for Children-Third Edition (BASC-3)
The BASC-3 is described by its authors as “a multimethod, multidimensional system used to evaluate the behavior and self-perceptions of children and young adults ages 2 through 25 years” (Reynolds & Kamphaus, 2015, p. 1). In this chapter, only the teacher (Teacher Rating Scale; TRS) and parent rating (Parent Rating Scale; PRS) for school-age children are covered. Self-report scales, developmental questionnaires, and observational techniques are also available in the BASC-3 suite. So too are rating scale versions devised for pre-school age children and college-age students, although these are not covered here. You will need to read the manual if you choose to use the BASC-3. In this chapter you will receive an overview, information on some studies using the BASC-3 (or an earlier version, the BASC-2), plus introduction to its use in practice. The Skills Workbook provides more detailed information on application.
BASC-3 Organization and Characteristics
Table 5.3 is a summary of the clinical scales found in the BASC-3 (i.e., TRS and PRS) and an overview of its organization. This table is worth studying because it conveys some of the logic behind the BASC-3. The table also begins to reveal how the BASC-3 might be used in practice (and hints at the source of its vast popularity).
Let’s start with the BASC-3’s Behavioral Symptoms Index (BSI) and see what the manual advises about interpretation. The BSI is examined clinically only after any validity concerns have been resolved (as covered earlier in this chapter [Table 5.2] and detailed in the manual). BSI represents an important composite derived from six narrow clinical scales (i.e., Hyperactivity, Aggression, Depression, Attention Problems, Atypicality, Withdrawal). As such, it enjoys both reliability and breath of content sufficient to help address a summary question—are ratings generally compatible or generally incompatible with a mental health problem (irrespective of type)? The BSI thus affords diagnosticians something more or less akin to a global social-emotional disturbance index. Examination of more fine-grained scales can follow, based in part on what the BSI conveys.
Next consider composite scores, some of which rest on long-established empirical foundations. For example, groundbreaking factor analytic studies conducted more than 50 years ago discovered that some symptoms cluster consistently across many, many raters. Specifically, ratings of children’s symptoms often group into two clusters that came to be described as “externalizing” as distinct from “internalizing” (Quay & Quay, 1964a; Quay, 1964b). As seen in Table 5.3, on the BASC-3 TRS and PRS each of the Externalizing and Internalizing composite scores derives from three narrower clinical scales. Contemporary studies continue to document the externalizing-internalizing distinction (Kendler, Prescott, Myers & Neal, 2003; Wright, Kreuger, Hobbs, Markon, Eaton & Slade, 2013). And, most school psychologists are familiar with both presentations. Children scoring high on the former largely represent problems to others (e.g., teachers, parents), whereas those with elevations on the latter largely represent problems to themselves. Accordingly, the BASC-3 reports Externalizing and Internalizing composites scores.
Other BASC-3 composites concern School Problems and Adaptive Skills. In some ways, these latter composites seem to logically reflect the distinction between social-emotional symptoms and signs on the one hand and impact on the life of the child on the other hand. For example, assume that a student’s BASC-3 profile reflects externalizing problems (signs of a mental health condition) coupled with diminished social skills and poor adaptability (adaptive impairments). These kinds of distinctions are practically important for school psychologists in general as well as specifically concerning the BASC-3. In fact, the notions of “disability” and “disorder” require documentation of real-world impact. An intellectual disability, for example, is not just low IQ. It is low IQ and concurrent impairments in adaptive behavior (American Association on Intellectual and Developmental Disabilities, http://www.aaidd.org/intellectual-disability/definition. In parallel, IDEA (a disability law) imposes requirements such as “adverse educational impact” in order to designate a student as disabled https://sites.ed.gov/idea/regs/b/a/300.8. In much the same vein, DSM-5 requires impairment (sometimes across several settings) for confirmation of many of its diagnoses (symptoms alone are insufficient to indicate the presence of a mental health disorder). All of this means that evidence of low adaptive functioning on the BASC-3, quantified by standard scores and resting on a large standardization sample, might prove quite helpful.
Table 5.3 BASC-3 Teacher Rating Scale and Parent Rating Scale Clinical Scales & Composites |
|||
|
Teacher |
Parent |
Self |
|
| EXTERNALIZING + Composite Score | |||
| HyperactivityBSI | Yes | Yes | Yes |
| AggressionBSI | Yes | Yes | No |
| Conduct Problems | Yes | Yes | No |
| INTERNALIZING + Composite Score | |||
| Anxiety | Yes | Yes | Yes |
| DepressionBSI | Yes | Yes | Yes |
| Somatization | Yes | Yes | Yes |
|
OTHER + Composite Score (School Problems) |
|||
| Attention ProblemsBSI | Yes | Yes | Yes |
| AtypicalityBSI | Yes | Yes | Yes |
| WithdrawalBSI | Yes | Yes | No |
| Learning Problems | Yes | Yes | No |
| ADAPTIVE + Composite Score | |||
| Adaptability | Yes | Yes | No |
| Social Skills | Yes | Yes | No |
| Leadership | Yes | Yes | No |
| Study Skills | Yes | No | No |
| Functional Communication | Yes | Yes | No |
| Activities of Daily Living | No | Yes | No |
| BSIItems on this scale contribute to the Behavioral Symptoms Index | |||
Next consider the BASC-3’s narrower clinical scales as seen in Table 5.3. It’s apparent that many match, at least in name, common mental health conditions described in Chapter 1 (e.g., depression, anxiety, conduct problems). Importantly, however, the manual offers advice, and at least a modicum of caution, about interpreting clinical scales. For example, before school psychologists look at fine-grained scales, they should scrutinize over-arching composite scores. This method of analysis helps school psychologists remain cautious about inferring specific problems (those related to inattention, hyperactivity, depression, anxiety) without first confirming the presence of a general problem. This method of sequential interpretation may remind school psychologists of interpreting the Wechsler Intelligence Scale for Children-5th ed. (WISC-V; Wechsler, Railford & Holdnack, 2014). On the WISC-V, full scale IQ is typically examined before one scrutinizes narrower index scores (e.g., Verbal Comprehension Index, Perceptual Reasoning Index) or subtest scores (e.g., Block Design, Vocabulary; Kaufman, 2016).
It may be already apparent that top-down interpretation can help constrain false positives. Imagine a school psychologist who skips over composite scores and then uncritically scrutinizes many narrow rating scale scores, each of which is imperfectly reliable. Because of reliability considerations alone, one or two scores may be elevated owing to chance. To conclude that you have found something important based on a single elevation like this is akin to a researcher who runs the same experimental versus control comparison on one dependent variable, then another dependent variable, then yet another…until she eventually finds a dimension on which the experimental group outperforms the control group. This is a cardinal research sin. It involves making a Type 1 error (equivalent to finding a false positive in clinical settings). Following the BASC-3 manual (i.e., start with the BSI and composites and move extremely cautiously if they are not elevated) may help reduce such errors.
Individual items (e.g., those asking a teacher or parent to rate a child’s activity level or his level of nervousness) might be examined next. Item level analysis requires even more caution. For example, if the BSI, Internalizing Problems, and Anxiety scales were all elevated, then the school psychologist might zero in on each of the BASC-3’s Anxiety items (i.e., 9 items rated by teachers and 14 items rated by parents). But it is dubious to scrutinize a single (unreliable) item absent composite elevations. When item level analysis does occur, diagnosticians can find all individual items in a printout. This makes it easy to see how a teacher or a parent rated each (e.g., perhaps strongly endorsed the presence of fear but not of pervasive nervousness). It is true that broadband scales are inherently nomothetic (they compare one student to many). Nonetheless, an idiographic purpose can also sometimes be served (knowing a student uniquely) via inspection of item-level responses. Of course, for some referral questions it is interesting to discover which items a teacher strongly endorses and which items they may not endorse at all. Detailed analysis like this might help add clarity to a particular scale elevation. Planning an intervention may also be easier if quite specific symptoms are recognized (a topic covered in Chapter 15). Novella Smith’s case management, covered later in this chapter, shows how item level information might inform the student interview process.
What about the critical item (red flag) feature? There are 13 “critical items” contained in the teacher and 23 “critical items” found in the parent BASC-3. Specifically, strongly-endorsed BASC-3 critical items show up in printouts with a bold font. Thus, it’s easy to see if a teacher or a parent has noticed a health problem (e.g., seizures), destructive behavior (e.g., fire setting), or tendencies for self-harm (e.g., a desire to be dead). These can help the school psychologist perform due diligence. If a teacher or a parent endorsed any of these, follow up would required. In fact, inclusion of critical items in printed form might speed parent or teacher interviews. The same is true regarding student interviews. You will see in Chapter 9 that the Generic Child Clinical Interview form requires diagnosticians to examine critical items every time a behavioral rating scale is used in conjunction with a student interview.
BASC-3 and Classification Validity
You learned about the importance of classification validity in Chapter 2. Recall that when binary diagnostic decisions are made (e.g., autism is present vs. autism is absent), then some simple computations can result in practice friendly statistics. These are sensitivity (rate of correct classifications of those with a condition) and specificity (rate of correct classifications of those without a condition). Like broadband scales generally, the BASC-3 is designed to assist in categorical decisions, including mental health diagnoses. This is not the only thing that these tools purport to do, but it is one thing that is intensively important. And to be fair to the BASC-3 authors, use of information from social and developmental history and from observation, both enabled by elements of the BASC-3 family, are advocated in the manual. But BASC-3 scores (i.e., from the TRS and PRS) are often central to those in the field. In fact, scores above the clinical level cut-score of T-score = 70 may get prime consideration in making diagnoses. And, indeed, diagnosis is at issue. In the words of the authors, “…the BASC-3 components aid in the clinical diagnosis of disorders that usually first appear in childhood or adolescents” (Reynolds & Kamphaus, 2015, p. 8, underline added). Clinical diagnoses relevant to school psychologists are, of course, those like ADHD, anxiety, depression, and autism.
Here’s an essential point: the BASC-3 manual provides nothing at all on the topic of sensitivity and specificity. Consequently, BASC-3 users are unable to go to the test manual for information necessary to create Diagnostic Likelihood Ratios (DLRs); see Chapter 2 for details. Among other limitations, this means that the manual does not enable use of probability nomograms. More broadly, school psychologists must operate lacking a key effect size indicator concerning classification validity (i.e., DLRs). We’ll see if the BASC-3 might address classification evidence a bit later. But for now, absent information from the manual, we’ll consider the post-publication peer reviewed literature and diagnostic utility statistics for the BASC-3 (and BASC-2).
Three published studies-concerning autism (autism spectrum disorder [ASD]) and ADHD–provide a sense of what has been done. In the first study, the 13-item Developmental Social Disorders scale from the BASC-2 was shown to distinguish youth with and without ASD (see Table 5.4; Bradstreet, Juechter, Kamphaus, Kerns, & Robins, 2016). The study implies that an elevated Developmental Social Disorders score probably contributes to correct ASD classification but effect sizes are rather modest. That said, added to other information DLRpositive values as high as nearly 3.0 and DLRnegative values as low as .33 might make meaningful contributions to probability nomograms. In a second study, two values from the BASC-3 PRS and TRS as well as the Autism Probability Index were documented to classify youth with ASD (see Table 5.5 Zhou, Reynolds & Kamphaus, 2021). Note that positive DLRs were associated with rather modest effect sizes, whereas negative DLRs were associated with larger effect sizes. This implies that negative scores (those below the cut-point) worked relatively better in this study (and perhaps in practice). In a third study, several BASC-3 scales in concert, not just the obvious Attention Problems and Hyperactivity clinical scales, were used to classify those with ADHD (see Table 5.6; Zhou, Reynolds, Zhu, Kamphaus & Zhang, 2018). Except for DLRnegative from parents, the effect sizes are not particularly impressive.
These three post-publication studies seem to concern the capability of BASC-3 scores to classify but they do so in a broad (research) sense. Thus, they may offer limited applied use. Indeed, researchers used cut-scores honed to their studies rather than the traditional T-score of 70. For example, Bradstreet and colleagues used cut-scores as low as 60; Zhou and co-researchers found that extremely low-cut scores were required to maximize correct detections and minimize incorrect diagnoses (e.g., 57 for Attention Problems; 54 for Hyperactivity). Also, researchers sometimes used sophisticated score combinations that practitioners may never themselves calculate. Also, each of these three studies represent stand-alone efforts without replication. This means that the sensitivity and specificity values (as well as resulting DLRs) reported would be unlikely to appear the same in a second, independent study. Cross-validation of the values seen in the preceding tables would need to occur via follow up studies if practitioners are to truly trust DLR values (such as for use in their own probability nomograms). Again, it is post-publication resources, not the test manual, that provides BASC-3’s users with diagnostic utility statistics (C. R. Reynolds, personal communication, May 9, 2022).
Table 5.4 Effect Sizes and DLR values for BASC-2 Developmental Social Disorders scale concerning Autism Spectrum Disorder (ASD) |
||||
| Comparison | Effect size associated with positive score | Diagnostic Likelihood Ratio Positive | Effect size associated with negative score | Diagnostic Likelihood Ratio Negative |
| 1ASD vs. non-ASD | Minimal |
1.9 |
Minimal |
.44 |
| 2ASD vs. no diagnosis | Small |
2.8 |
Small |
.33 |
| 3ASD vs. other diagnosis | Minimal |
1.7 |
Minimal |
.60 |
|
1Cut-score T-score = 61;2Cut-score T-score = 60;3Cut-score = T-score = 63. Adapted from Bradstreet, et al. (2016)
|
||||
Table 5.5 Effect Sizes and DLR Values for the BASC-3 concerning ASD |
||||
| Source of Rating | Effect size associated with positive score | Diagnostic Likelihood Ratio Positive | Effect size associated with negative score | Diagnostic Likelihood Ratio Negative |
| Parent 3 scales | Small | 4.75 | Large | .06 |
| Parent Autism Probability Index | Small | 4.61 | Large | .04 |
| Teacher 3 scales | Small | 4.10 | Moderate | .18 |
| Teacher Autism Probability Index | Small | 2.97 | Moderate | .12 |
| Source: Zhou, Reynolds and Kamphaus (2021) | ||||
Table 5.6 Effect Sizes and DLR Values for BASC-3 Concerning ADHD |
||||
| Source of Rating | Effect size associated with positive score | Diagnostic Likelihood Ratio Positive | Effect size associated with negative score | Diagnostic Likelihood Ratio Negative |
| BASC-3 Teacher Report Form, several scores combined | Small | 2.6 | Small | .31 |
| BASC-3 Parent Report Form, several scores combined | Minimal | 1.9 | Moderate | .12 |
| Adapted from Zhou, Reynolds, Zhu, Kamphaus & Zhang (2018) | ||||
Skeptical readers might ask why there is a need to consider diagnostic utility statistics and the BASC-3. After all, this topic may have been foreign to them before reading this book’s Chapter 1. Moreover, topics like sensitivity, specificity and DLRs are rarely on the lips of their colleagues and supervisors. Maybe the BASC-3 manual is simply giving users what they want, and they don’t really care about sensitivity and specificity. Regarding the BASC-3, its manual gives readers average values for various clinical samples, perhaps to demonstrate that scores work for classification. You can see a few of these in Table 5.7. By the way, the manual does not appear to include statistical differences between clinical and control groups (a shortcoming you were warned about in Chapter 2 via the example of men’s and women’s heights). Check out the Table 5.7 (also consider visiting pages 161 and 213 in the manual for many, many more mean values). It should be obvious from Table 5.7 that BASC-3 scores cannot classify perfectly. In fact, mean values for many clinical groups fall into the “at risk” range (short of the “clinical range”). Plus, for some clinical groups, means for scales that should seem to, intuitively, be elevated are found to actually fall in the “average range”. Logically, school psychologists using cut-scores of T = 70 would seem to miss many students (but without diagnostic utility statistics the rate of correct classification remains unknown). You are warned, including by the BASC-3’s authors themselves, not to use scores alone to conclude a particular problem is either non-existent or that it is present.
Table 5.7 BASC-3 Parent Rating Scale Means and Standard Deviations for Selected Clinical Groups |
|||||
| All clinical groups | ADHD group only | ASD only | EBD only | Speech- language only | |
|
Selected BASC-3 PRS composites
|
|||||
| Externalizing | 58.1 (13.8) | 60.2 (12.7) | 55.4 (13.4) | 66.6 (16.1) | 50.7 (11.3) |
| Internalizing | 55.5 (12.3) | 55.1 (11.3) | 55.5 (12.6) | 64.0 (14.3) | 50.0 (10.7) |
| BSI | 60.5 (12.8) | 61.3 (11.6) | 63.3 (12.5) | 67.7 (13.8) | 51.9 (11.2) |
| Selected BASC-3 TRS composites (p. 161) | |||||
| Hyperactivity | 55.1 (12.3) | 56.5 (12.6) | 56.3 (11.5) | 58.4 (13.3) | 49.3 (10.5) |
| Attention Problems | 57.7 (10.3) | 59.3 (9.9) | 59.9 (9.3) | 57.6 (10.9) | 50.8 (10.3) |
| Anxiety | 56.9 (13.4) | 53.6 (12.8) | 59.4 (13.2) | 62.5 (14.2) | 52.6 (12.6) |
| Depression | 56.4 (13.4) | 53.8 (11.8) | 60.2 (14.1) | 63.9 (15.0) | 48.9 (8.5) |
| Bold indicates mean values falling in the “at risk” range (i.e., T-scores > 60). Source: BASC-3 manual p. 161 and p. 213. | |||||
You have heard a lot of talk in Chapter 2 about “probability” and the probability nomogram. Thus, it’s important to mention the term probability as used in the BASC-3 (e.g., the BASC-3 “Autism Probability Index).” This is a specialized scale whose scores are reported as T-scores. For reasons you learned about in Chapter 2 (e.g., base rate considerations), a score on this scale cannot indicate the probability that autism is present in your particular setting. The same is true for the “ADHD Probability Index” and the “EDB Probability Index.” As you saw above, the manual provides mean values for clinical groups on these scales, but it does not provide diagnostic utility statistics (and certainly not probability statements-how likely a particular student is to have a given condition). You are encouraged to examine Table 5.8 and to reflect on the numbers seen there.
| Table 5.8 BASC-3, various probability index scores and values for clinical sample | |||||
| All clinical groups | ADHD group only |
ASD only |
EBD only |
Speech- language only |
|
|
Teacher Report Scale (p. 161) |
|||||
| ADHD Probability Index | 57.8 (10.4) | 58.8 (10.3) | 60.6 (9.2) | 58.5 (11.5) | 50.9 (10.0) |
| EBD Probability Index | 56.2 (12.4) | 54.7 (11.3) | 58.6 (12.1) | 63.0 (15.0) | 50.0 (9.9) |
| Autism Probability Index | 58.0 (11.9) | 55.6 (10.0) | 66.7 (11.7) | 59.3 (11.1) | 50.6 (8.6) |
|
Parent Report Scale (p. 213) |
|||||
| ADHD Probability Index | 61.0 (10.8) | 64.4 (9.4) | 61.5 (10.0) | 62.7 (11.4) | 51.2 (10.1) |
| EDB Probability Index | 58.7 (13.1) | 59.5 (12.8) | 58.3 (11.4) | 68.2 (14.2) | 51.9 (10.8) |
| Autism Probability Index | 59.0 (13.2) | 56.8 (11.2) | 69.5 (14.6) | 61.1 (12.4) | 52.7 (11.0) |
|
Bold font denotes mean values that fall into the “at risk” range (i.e., T > 60).
ASD = Autism Spectrum Disorder; EDB = Emotional Behavior Disorder. Adapted from the BASC-3 manual (Reynolds & Kamphaus, 2015)
|
|||||
Additional Thoughts about Using the BASC-3’s
Scant evidence of classification validity notwithstanding, the BASC-3 enjoys diverse school psychology uses. This includes helping to decide if a mental health condition is present. Later in this chapter, Patrick O’Connor uses it routinely to avoid missing emotional problems as he conducts SLD-oriented evaluations. Novella Jones employs it as a center piece when she is referred a student with potential social-emotional problems. You will see other applications of the BASC-3 in Chapter 11 (concerning a student with potential autism) and Chapter 12 (concerning a student with potential ADHD). The case of Breanna in Chapter 7 demonstrates how BASC-3 results can help inform other assessment practices, in this instance a student interview. Skills Workbook exercises will also help you think about BASC-3 applications.
Conners Comprehensive Behavior Rating Scale (Conners CBRS)
The Conners CBRS (Conners, 2010) is one of several tools developed by a clinical psychologist named C. Keith Conners. His lengthy and influential career involved many aspects of assessment and intervention, including seminal research on ADHD (Stein & Newcorn, 2018). The Conners CBRS is described as “a comprehensive assessment tool that assesses a wide range of behavioral, emotional, social, and academic concerns and disorders in children and adolescents” (Conners, 2010, p. 1). It comprises options for teachers and parents to complete (discussed in this chapter) as well as for a youngster to complete himself (discussed in Chapter 6). Its age range is from 6 to 18 years. Thus, the Conners CBRS is applicable for most school referrals, but not those arising in early childhood education programs or sometimes in kindergarten. There is a separate version for preschoolers (the Conners Early Childhood, Conners, 2009). There is also the Conners-3 (Conners, 2009) for ADHD and related disorders, which is covered in Chapter 11. The nearly identical titles can prove confusing. In this chapter, however, it is just the teacher and parent report versions of the Conners CBRS (with the green manual cover) that are addressed. Research suggests that the Conners CBRS enjoys some use by school psychologists, but dramatically less than the BASC-3 (Benson, Floyd, Kranzler, Ekert, Fefer & Morgan, 2019). Still, some school psychologists adopt routine Conners CBRS use and consistently employ it over the BASC-3 and other competitors.
Like other broadband scales, the Conners CBRS requires little school psychologist time. The prime burden is scoring, and of course interpretation. Like most contemporary psychometric tools, however, automated scoring makes score generation quite easy and fast. Those wishing to use this instrument should first read its manual. A simplified guide prepared by Elizabeth Sparrow (2010) might also prove helpful. This chapter’s information is simply an orientation.
Conners CBRS Organization and Characteristics
The Conners CBRS (parent or teacher versions) comprises 203 or 204 items. These items provide information on more than 50 dimensions, addressing the following superordinate categories:
- Content scales
- DSM-IV-TR symptom scales
- Validity scales
- Index
- Other clinical scales
- Impairment items
- Critical items
- Additional questions
Table 5.9 summarizes details within a few of these broad categories. Some of the dimensions seem similar to those found on the BASC-3. And it is easy to envision how this array of scores might support those confronting a host of assessment situations. Like the BASC-3, the Conners CBRS includes validity scales and content scales, which are rather straightforward. There is also a global indicator (the 24-item Conners Clinical Index; Conners CI), which aims to categorize an individual child as more like a member of the general population than a child with a clinical diagnosis. In this sense, the Conners CI calls to mind the BASC-3’s BSI, but as you will read below that the two are actually quite distinct. We take a critical look at the Conners CI a few paragraphs below.
Table 5.9 Conners Comprehensive Behavior Rating Scale Content, DSM, Validity, Index, and Impairment Scales |
|
| Content scales | Emotional distress (upsetting thoughts, worrying, upsetting, thought/physical symptoms, social anxiety) |
| Defiant/aggressive behaviors | |
| Academic difficulties (language, math) | |
| Hyperactivity | |
| Hyperactivity/impulsivity | |
| Social problems | |
| Separation fears | |
| Perfectionism and compulsive behaviors | |
| Violence potential indicator | |
| Physical symptoms | |
|
DSM-IV-TR symptoms scales†
|
ADHD, predominately inattentive type |
| ADHD, predominately hyperactive-impulsive type | |
| Conduct disorder | |
| Oppositional defiant disorder | |
| Major depressive episode | |
| Manic episode | |
| Generalized anxiety disorder | |
| Separation anxiety disorder | |
| Social phobia | |
| Obsessive-compulsive disorder | |
| Autism disorder | |
| Asperger’s disorder | |
| Validity scales | Positive impression |
| Negative impression | |
| Inconsistency index | |
| Impairment items | School work/grades |
| Friendship/relationship | |
| Home life | |
| †Allows both symptom count pertaining to DSM and calculation of T-score values (see p. 46) | |
The Conners CBRS manual helps guide score interpretation. Diagnosticians are advised to first check validity scales, then interpret scale scores (regarding content and DSM), then examine all indexes, such as those pertaining to impairment, as well as the Conners CI. They ultimately scrutinize fine-grained details, such as individual general items or those designated to be critical. As with the BASC-3, the first level of interpretation is largely nomothetic in nature. In contrast, latter item-level scrutiny (if it is used) might serve idiographic purposes.
The manual advises users to consult several sources of information rather than investing all of their trust in rating scale scores. And there are cases (e.g., Monty B. found in Chapter 8 of the Conners CBRS manual) that provide a bit a guidance about how this might be done. These include the familiar sources you saw in Chapter 1, review of school records, interview with family/caregivers, and student observation. Thus, one might logically conclude that the manual, at least implicitly, harmonizes with this book’s HR approach, as well as the sometimes-used probability nomogram.
The Conners CBRS and Classification Validity
Unlike the BASC-3, the Conner’s CBRS provides plenty of information about classification validity (referred to by the publisher as “discriminant validity”). Specifically, Chapter 12 of the manual provides extensive coverage of familiar diagnostic utility statistics. As is typical among broadband rating scales, a number of clinical samples were assessed to help establish evidence of validity. These include groups comprised of individuals with the following conditions:
- ADHD Inattentive
- ADHD Hyperactive-Impulsive
- ADHD Combined
- Disruptive Behavior Disorders
- Major Depressive Disorders
- Bipolar Disorder
- Anxiety Disorders
- Pervasive Developmental Disorders
The resulting data enable calculation of diagnostic utility statistics. For illustrative purposes, we look only at several Conners CBRS DSM-related symptom scales (see Table 5.10). But many other Conner’s CBRS scales were subject to analysis, and scores associated with those analyses are available in the manual. Information in Table 5.10 includes DLRs, which were calculated for our purposes and which might be plugged into the center column in a probability nomogram in practice. Although DSM-5 has now replaced DSM-IV-TR, the findings reported in the manual presumably still hold true.
Table 5.10 Effect Sizes and DLR Values for Conner CBRS DSM-related Scales Predicting Categorization in Clinical vs. Representative Samples |
||||
| Source of Rating | Effect size associated with positive score | Diagnostic Likelihood Ratio Positive | Effect size associated with negative score | Diagnostic Likelihood Ratio Negative |
| Teacher | ||||
| ADHD Hyperactivity-Impulsivity | Small | 2.9 | Minimal | .57 |
| ADHD Inattentive | Small | 3.0 | Small | .42 |
| Generalized Anxiety Disorder | Small | 4.8 | Small | .38 |
| Major Depressive Disorder | Moderate | 6.8 | Moderate | .20 |
| Autism | Moderate | 6.8 | Small | .28 |
| Parent | ||||
| ADHD Hyperactivity-Impulsivity | Moderate | 5.2 | Minimal | .53 |
| ADHD Inattentive | Small | 3.4 | Small | .41 |
| Generalized Anxiety Disorder | Moderate | 5.0 | Minimal | .62 |
| Major Depressive Disorder | Moderate | 5.0 | Small | .35 |
| Autism | Moderate | 7.8 | Moderate | .16 |
Consider the values found in Table 5.10 for a moment as we reflect on what they might mean. Start by assuming a teacher’s ratings produced a negative test score. Go to the last row in the table under “Teacher” and read across. The negative DLR (the student scored below the cut-point) of .28 could dramatically reduce the chance that the student indeed evidences autism. The same is true even more decidedly, if a negative score on autism were found on a parent Conners CBRS (negative DRL = 16), found in the last row under “Parent.” Positive scores (the student scored above the cut-point) from either a teacher or a parent, in contrast, would dramatically boost the prospect of autism (e.g., positive DRLs = 6.8 and 7.8, respectively). Two positive scores together (one from a teacher and another from a parent) would elevate the probability even more. As you saw in Chapter 2, two probability nomograms can be sequentially completed in the latter instance. It’s worth remembering, however, that the magnitude of decreased probability associated with a negative score and the magnitude of increased probability associated with a positive score depends on the pre-test probability (see Chapter 2). The relationship is not linear. Even more important, negative scores in the presence of high pre-test probability (e.g., a setting with a high base rate) can sometimes leave the case with a fairly high post-test probability. Similarly, a positive score in the presence of a low pre-test probability (e.g., a setting with a low base rate) can sometimes leave the case with a fairly low post-test probability. This reality partially vindicates school psychologists’ preference for diverse sources of assessment information en route to a final estimate of probability.
Inquisitive users can consult the Conners CBRS manual themselves for their own look at unvarnished clinical utility statistics. In Chapter 12 of the Conners CBRS manual, they can find classification accuracy for several content and DSM symptom scales juxtaposed with various clinical samples. What’s found might seem either encouraging or discouraging. Sensitivity values range widely (e.g., as low as .53 predicting ADHD Hyperactive-Impulsive membership to as high as .83 predicting Oppositional Defiant Disorder membership). Much the same is true regarding specificity (e.g. as low as .78 regarding ADHD-Inattentive membership to as high as .93 predicting Anxiety Disorders membership). To simply things, the Conners CBRS manual provides an “overall correct classification rate.” It summarizes the percent of true positive plus true negatives calculated against all cases. In other words, a single number indicates the percentage of all cases that were correctly classified at particular cut-score (relative to a particular Conners CBRS scale and a particular clinical group). But sadly, no cut-score values are specified in the manual. You can assume, however, that the cut-score that optimized correct classifications was probably selected to produce these score. Listed below are a few percentages of total correct classifications with the teacher version of the Conners CBRS:
- ADHD Inattentive .75
- ADHD Hyperactive-Impulsive .78
- Oppositional Defiant Disorder .90
- Major Depressive Episode .87
- Generalized Anxiety Disorder .82
- Autism Disorder .89
Here’s the take home point. Used alone, scores from Conners CBRS scales (even under completely optimum circumstances for prediction) would result in many misclassifications. There is simply no escaping the reality that some students with scores above a cut-point would be free of their score-associated problems whereas others with scores below a cut-point would experience their score-associated problem. For both inattentive and hyperactive types of ADHD, for example, roughly one-quarter of students would be wrongly classified. At the risk of repetitiveness, this reaffirms the warning never to trust test scores alone for important decisions.
There are two final practical notes about Conners CBRS classification validity. First, cut-scores are not listed in the manual’s section on diagnostic utility statistics. This means that most users are left with uncertainty about how to proceed. Should they rely on the manual’s standard cut-points or adopt another cut-point to calculate DLRs for practice use? Second, these seemingly attractive values in the manual may not turn out to be so attractive in the real world. This is true because there is no evidence in the manual that cross-validation studies were conducted. With cross-validation, more modest diagnostic utility statistics would naturally be expected to appear.
Does the Conner’s CBRS Alone Convey Probability?
The omnibus Conners CI embraces “probability.” But let’s see if this use makes sense based on what you already know about probability in applied settings. Consider a hypothetical 7-year-old boy named Alejandro North. His parents completed a Conners CBRS, which resulted in the aforementioned Conners CI appearing among the pages of his printout. Here’s the exact printout wording, “Based on parents’ ratings, a clinical classification is indicated (73% probability)….” (MultiHealth System Inc., 2008, 2014). What does this actually mean and how is the test publisher able to generate such a probability statement from a single Conners CI? Is this plausible?
Seemingly not. It is unclear how a common conversion table (with just one set of numbers) could used for five conditions: Disruptive Behavior Disorder; Mood Disorder; Learning or Language Disorder; Anxiety Disorder; ADHD that are the genesis of the Conners CI. After all, different DLRs would result from empirical research on these five dimensions. It appears that only the most elevated of these five scores for each child would be used to generate a probability statement. But you might have already anticipated an even bigger barrier to pronouncements about probability–probability estimates in the field depend not just on test scores of a student seated across from you but also on base rate (local prevalence rate). In light of these considerations, it seems wise to treat probability statements generated by Conners CBRS printout with skepticism. Alejandro might have a probability somewhere around 73%, but a lot depends on other factors including the setting in which Alejandro was assessed.
Additional Thoughts about Using the Conners CBRS
The forgoing imperfections certainly do not eliminate all the advantages that practitioners might experience when using the Conners CBRS. Like the BASC-3, the Conners CBRS enjoys the array of pluses shared by all broadband rating scales. Conners CBRS results, for example, could be scrutinized for indications of invalid teacher or parent responding. Regarding the nature of potential social-emotional problems, a student can be judged on many composite and narrow constructs (e.g., DSM symptoms of OCD or ASD). Like the BASC-3, the Conners CBRS addresses impairment, although with just a few items (e.g., concerning home or social capability). Critical items could be checked for red flags prompting follow up student interviewing. Also like the BASC-3, the Conners CBRS has diverse practice uses, one of which you will see later in the chapter in the practice of Dr. Maritza.
ASEBA Child Behavior Checklist and Teacher Rating Form
The Child Behavior Checklist (CBCL; Achenbach & Rescorla, 2001) stands as an historically important instrument, with its development dating from the 1960s. Since then, it has served as the dependent variable in literally thousands of research studies, a reference list of which is available at the ASEBA website. https://aseba.org/bibliography/ (downloaded August 16, 2020). The CBCL still possesses contemporary relevance for school psychologists, even though it remains more popular in clinics than on school campuses. Importantly, the CBCL is part of a vast, integrated suite of tools cumulatively entitled the Achenbach System of Empirically Based Assessment (ASEBA). The ASEBA Teacher Report Form (TRF; Achenbach & Rescorla, 2001) is also covered in this chapter. The ASEBA Youth Self-Report (YSR) is covered in the next chapter. The most remarkable aspect of the ASEBA is its vast age range (from toddlers [1 and one-half years] to 90-year-olds) and breath (forms for parents, teachers, self-report, and observation, all measuring the same dimensions). For example, the ASEBA system has a unique feature that makes it appealing to school psychologists—its observation system taps the same dimensions as all the other tools. In part, this permits ASEBA observations to serve both idiographic and nomothetic purposes. As you will see in Chapter 8, this attribute can solve the challenge of integrating classroom observation findings with rating scale information.
CBCL and TRF Organization and Characteristics
For the CBCL and the TRF, school psychologists will find a Total Problems score, plus composite Internalizing Problems and Externalizing Problems scores. As you might anticipate, there are also numerous finer-grained dimensions, either based on factor analysis (called syndromes) or DSM, which appear below.
Factor analysis based (syndrome) scales:
· Anxious/depressed
· Withdrawn/depressed
· Somatic complaints
· Social problems
· Thought problems
· Attention problems
· Rule-breaking behavior
· Aggressive behavior
DSM-5 based:
· Depressive problems
· Anxiety problems
· Somatic problems
· Attention deficit/hyperactivity problems
· Oppositional defiant problems
· Conduct problems
Levels on all of these are reported as T-scores (and percentile ranks). The manual details the process and accompanying rationale for converting item level scores to T-scores. The authors used a process that involved adjusting (truncating) some scores. As relevant to practice in the field, this procedure was designed to prevent diagnosticians from over-interpreting the levels of some scores as well as to constrain unwarranted inferences about profile score differences. Regarding score interpretation, the following levels are specified: “borderline” T-scores ranging from 65 to 69; “clinical range” T-scores > 70. Borderline scores seem to be especially important, “if users wish to dichotomously classify children’s scores as being clearly in the normal range vs. high enough to warrant concern, we suggest using T scores below 65 to designate the normal range vs. T score > 65 to designate the clinical range on the syndrome scales” (Achenbach & Rescorla, 2001, p. 90). Cut-points of T-score = 65 appear to have been used to generate odds ratios, as discussed in the section below concerning classification validity.
Besides the scales mentioned above, the CBCL supplies competency scores, an important feature for those seeking areas of strength or otherwise concerned with adaptive functioning. Included are areas labeled Activities, Social and School, each of which provides T-scores (high scores indicate strengths). There is also a norm-referenced “Total Competence” score. In parallel, the TRF supplies adaptive functioning scores pertaining to classroom considerations (e.g., Academic Performance, Working Hard) plus a “Total Adaptive” score. Higher T-scores denote better adaptation. ASEBA’s concern with competency and adaptive success sometimes helps inform an idiographic, not just a nomothetic, perspective. For example, the TRF, because of the centrality of teacher concerns and observations in school psychology practice, might be especially significant. Specifically, the TRF prompts teachers to provide perceptions about student’s success and observations related to their expression of achievement (e.g., open-ended inquiry about a pupil’s work, behavior and potential; a prompt to the describe “best things” about the pupil) that are potentially idiographic. The CBCL does much the same from parents’ perspective. And identified strengths and supports can be transferred to the back page of the HR Worksheet to facilitate wide-ranging conceptualization of the student and enable intervention planning. CBCL and TRF record forms (as well as objective profiles) hence work well with parent and teacher interviews (Achenbach & Rescorla, 2001). You will see more about this in Chapter 9, where the ASEBA YRS can help set the stage for a post-rating-scale student interview.
Like with the BASC-3 and Conners CBRS, potential users need to examine the test manual with a critical eye. That said, the CBCL seems to offer some strengths not entirely evident in its competitors. One of these concerns multiculturalism. CBCL software permits generation of profiles that rest on society-specific norms. Rescorla et al. (2007) first proposed the term “multicultural robustness” when an instrument’s reliability and validity have been supported through international research (Viola, Garrido & Rescorla, 2011). This is the case with many ASEBA tools. For example, the CBCL has been translated into more than 85 languages; it has been used in many international studies to assess children’s behavioral and emotional problems (Achenbach & Rescorla 2007).
CBCL and TRF and Classification Validity
The manual provides evidence of classification validity largely by comparing an omnibus clinical sample (referred youth) with a control (non-referred) sample. For our practical purposes of using rating scales (rather than making judgements about which scales are best) information about correct classifications is most important. This is true, even though the manual provides extensive information in the form of descriptive statistics, statistical significance, and effect sizes when various ASEBA scales were used to compare clinical and matched control samples. Sensitivity and specificity are not reported per se, but odds ratios (similar risk ratios and DLRs) are extensively reported. In the words of Achenbach and Rescorla (2001, p. 120), “the OR (odds ratio) indicates the odds of having a particular condition (usually a disorder) among people who have a particular risk factor, relative to the odds of having the condition among people who lack that risk factor.” It appears that T-scores > 65 were used to consider a score indicative of a condition/diagnosis in the calculation of values found in Table 5.11.
Table 5.11 Odds Ratios Associated with Positive ASEBA CBCL and TRF Scores |
||
|
CBCL |
TRF |
|
| Empirically Based | ||
| Anxious/Depressed | 9 | 5 |
| Withdrawn/Depressed | 10 | 4 |
| Somatic Complaints | 6 | 2 |
| Social Problems | 11 | 6 |
| Thought Problems | 12 | 6 |
| Attention Problems | 12 | 6 |
| Rule Breaking Behavior | 12 | 6 |
| Aggressive Behavior | 16 | 6 |
| Internalizing | 8 | 5 |
| Externalizing | 12 | 7 |
| Total Problems | 14 | 9 |
|
DSM-Oriented |
||
| Affective Problems | 13 | 6 |
| Anxiety Problems | 8 | 6 |
| Somatic Problems | 4 | 2 |
| ADH Problems | 10 | 6 |
| Oppositional Defiant Problems | 13 | 7 |
| Conduct Problems | 17 | 8 |
| Source: Achenbach and Rescorla (2001). | ||
Post-publication evidence of classification validity for the CBCL and TRF, including indications of effect size and DLRs are found in Chapter 11 of this book (autism) as well as in Chapter 12 (ADHD). School psychologists often address the administrative category of emotional disturbance (ED). Here too, the suite of ASEBA tools may be helpful. In a study concerned with another rating scale (the Devereux Scales of Mental Disorders, which appears in the next paragraph), TRF was coincidentally shown to possess classification validity. Scanning down to Table 5.12 will permit you to see specific DLRs. By the way, on the very same topic (ED identification), detailed discussion of CBLC and TRF, together with an ASEBA observation tool, is reviewed in Chapter 8.
Devereux Scales of Mental Disorders
Another set of broadband tools bears the title of Devereux. (The scales were developed by a large network of residential, day school and outpatient treatment facilities with the name Devereux in the title [now called Devereux Advanced Behavioral Health System]). The tools cover pre-school and school-age youth. The Devereux version most similar to the BASC-3 and Conners CBRS is the Devereux Scales of Mental Disorder (Naglieri, LaBuffe & Pfeiffer, 1994). Like the BASC-3 and Conners CBRS, this is a fairly lengthy scale with 111 items for children and 110 for adolescents. The parent version corresponds to DSM categories. But the teacher version, the Devereux Behavior Rating Scale-School Form (Naglieri, LaBuffe & Pfeiffer, 1993), focuses on federal criteria for emotional disturbance. Again, reading the manual is necessary for those contemplating using any of these scales.
Devereux Scales of Mental Disorders and Classification Validity
One study (Reddy, Pfeiffer & Files-Hall, 2007) using the Devereux might hold special relevance to school psychologists. It involved special education classification. The study concerned the use of two broadband, teacher-completed scales (Devereux and ASEBA TRF) to predict whether students (matched on age, gender, and ethnicity) fell into a special education category (emotional disturbance; ED) or regular education. As already discussed, special education classifications are administrative, not clinical designations, and each category (including ED) is heterogeneous. In fact, this ED sample came from two large school districts, apparently involving several schools and diverse multi-disciplinary teams. Both the Devereux and the ASEBA TRF proved successful in distinguishing the two groups (see Table 5.12, which presents DLRs calculated from sensitivity and specificity information determined in this study). A couple other things prove potentially important in this study. First, various cut-scores were examined, but T = 60 consistently produced the highest rate of correct classifications, working better than a traditional cut-score of T-score = 70. Second, both broadband rating scales (Devereux and TRF) are able to generate a composite score, and this was used to predict educational placement. In other words, there was no need to resort to profile configurations, several composite scores, or many individual scales’ scores to predict educational placement.
But this is just a single study, requiring caution. For example, it involved only 74 ED and 74 control students. It necessarily reflected ED identification practices confined to a mere two school districts, and the conclusions are now 12 years old. Moreover, these exact numbers have never been cross-validated. Nonetheless, the possibilities for school psychologists should be apparent. For school psychologists interested in accessing probability estimates to help circumvent errors of diagnostic decision making and willing to collect just a bit of local information (e.g., base rate), there await substantial potential advantages. For illustrative purposes, one can see the result of a positive Devereux score and a negative one in a school district with a very high base rate (~60%) of ED among referred students (Figure 5.6). With a positive score, the likelihood of ED would approach 90%. With a negative score, it would seem as likely as not that the student is without ED.
Table 5.12 Effect sizes and DLR Values Associated for Devereux Scales of Mental Disorders and ASEBA Teacher Rating Form Concerning Emotional Disturbance |
||||
| Source of Rating | Effect size associated with positive score | Diagnostic Likelihood Ratio Positive | Effect size associated with negative score | Diagnostic Likelihood Ratio Negative |
| Devereux Scales of Mental Disorders | ||||
| 5-12 years of age | Small | 4.0 | Small | .44 |
| 15-18 years of age | Moderate | 5.0 | Minimal | .58 |
| ASEBA Teacher Rating Form | ||||
| 5-12 years of age | Small | 3.6 | Small | .28 |
| 15-18 years of age | Small | 4.5 | Small | .41 |
| Cut-score T-score + 60 | ||||
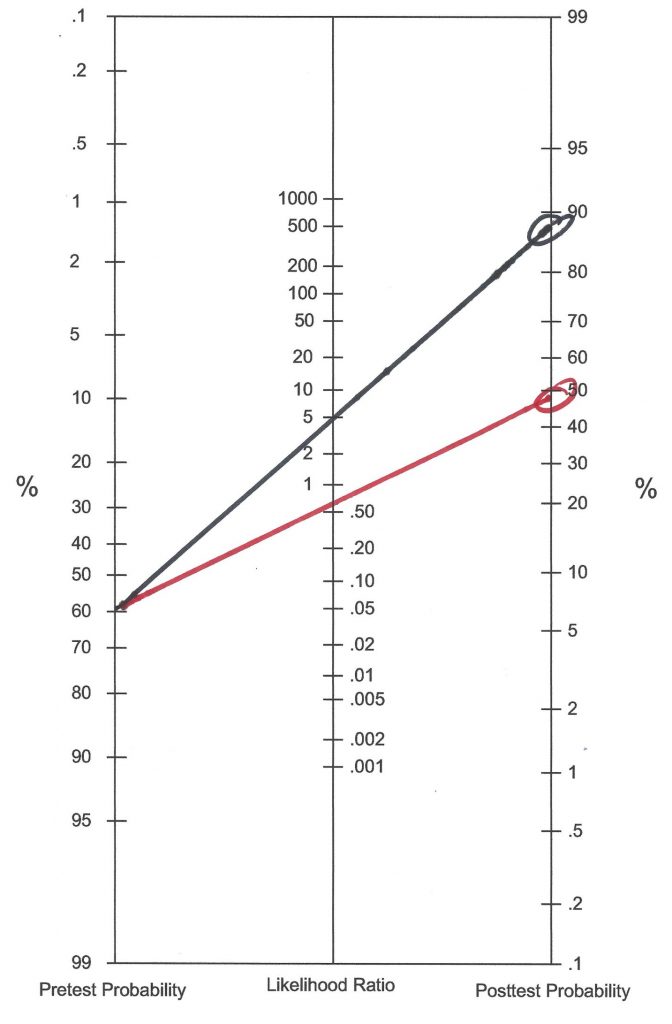
Cases and Considerations for Broadband Scales Usage
It takes practice to use broadband rating scales. Their capabilities (as well as their limitations) tend to manifest over time and following repeated use. Three cases in which broadband scales are used appear below.
Dr. Maritza: Finding Reasonable Solutions
Maritza Flores is employed in a rural elementary school district comprising just two campuses. During her 20-year tenure in this district she has enjoyed considerable autonomy and abundant respect from both school staff and parents, nearly all of whom referred to her simply as Dr. Maritza. And then things changed. After a new superintendent was hired, he promptly instituted an approach that contrasted with his predecessor by its decidedly more hands on character. In this tiny school district, the superintendent serves as Dr. Maritza’s immediate supervisor.
A few months into his reign, the new superintendent issued several decrees directly affecting special education and indirectly affecting school psychology. One of these Dr. Maritza found particularly objectionable. After reviewing several of the previous years’ psychoeducational evaluations, the superintendent informed Dr. Maritza of concern that her reports were insufficiently thorough. More specifically, the superintendent complained that there was no assessment for autism. This was held to be a major shortcoming because autism is one of the IDEA categories covered by the Child Find stipulation. As examples, the superintendent showed Dr. Maritza two evaluations in which students were identified with specific learning disabilities. Neither report mentioned anything at all about autism. Upon re-examining the two student files, Dr. Maritza told her boss that both cases were absolutely devoid of any background or observational information suggesting autism. Hence, she saw no need to mention a condition that was patently non-existent. But Maritza, hoping to foster a cooperative relationship with her supervisor, conceded the superintendent’s point. To accommodate him, she suggested beginning to add commentary to the Background Information and Behavioral Observation sections of her reports. In the first of these two places she would (when appropriate) add statements such as “a review of the student’s record suggests nothing compatible with the presence of autism.” In the second place, she would add statements such as “the student made good eye contact, engaged in turn-taking conversations several times during the assessment sessions, and seemed socially related. There was nothing observed consistent with the presence of autism.”
To her surprise, Maritza’s suggestions were viewed as wholly unacceptable. The superintendent contended that any dimension that had not been expressly assessed by a psychometric tool had not been adequately addressed. Maritza (again) capitulated. She agreed that for future cases where special education was at issue, she would administer a Conners CBRS to both the student’s current teacher and to his primary caregiver/parent. Maritza’s logic was this. The Conners CBRS includes two assessments for autism, the first a 14-item index concerning “autism disorder,” the second an 8-item index concerning “Asperger’s disorder.” Dr. Maritza promised to routinely add a statement to her reports. The following is an example: “Objective ratings of autism and related disorders were completed by both the student’s current teacher and his caregiver/parent. Scores from these measures fell within the nonclinical range and were interpreted as contraindicating the presence of autism. Coupled with a review of the student’s records that suggested nothing compatible with the presence of autism, and with observations suggesting the same conclusion, it is judged that the student is extremely unlikely to meet special education criteria for autism disorder.” This left the superintendent satisfied. Dr. Maritza recognized that these steps required little effort on her part (in most cases referred for suspected SLD, she had already administered Conners CBRSs). She needed merely to quickly check scores before adding a comment. Broadband rating scales work well in situations like this, where each case of potential SLD is screened for social-emotional problems. The superintendent’s position, nonetheless, left Dr. Maritza chagrined.
Patrick O’Connor: Practicing in an RTI world
Patrick O’Connor works in an elementary school that has wholeheartedly adopted a Response to Intervention (RTI) philosophy and all of the procedures that accompany it. Following some initial resistance, RTI has been embraced equally ardently by administrators, special educators, classroom teachers, and school psychologists. Indeed, a tiered system of intensified reading instruction, coupled with scrupulous progress monitoring, has apparently boosted districtwide reading scores. In addition, the RTI procedures seem to have help diminish requests for psychoeducational evaluations (and even ultimate special education placements). Data over the past five years confirms these changes. The same analysis, however, confirmed another reality. Almost no elementary students are now being identified with emotional disturbance (ED). Nearly every new special education determination involves a student in the specific learning disability (SLD) category. And, as RTI practices have grown, the detailedness of school psychologists’ individual evaluations has shrunk.
As a new school year kicks off, Patrick and his school psychology colleagues have instituted a new standard operating procedure. It involves the administration of the BASC-3 to every student as part of the special education assessment process. In essence, the BASC-3 will be used procedurally in every case of potential special education eligibility. The school psychologists’ rationale corresponds to the IDEA definition of SLD. That is, ruling in SLD involves ruling out ED (you will see more about this in Chapter 10). Broadband rating scales provide an off-the-shelf method to assist in this process. The school psychologists decided that any BASC-3 score in the at-risk range would require additional scrutiny. An at-risk elevation on anxiety, for example, may warrant a parent interview as well as a face-to-face student interview. As the discerning reader might recognize, Patrick’s problem and Maritza’s problem were resolved similarly—via routine use of broadband rating scales.
Patrick implemented this procedure on his very first case of the new school year, which involved a 9-year-old student referred for reading problems. The results are presented in Table 5.13. The efficiency of this method is transparent. Patrick need merely scan across the content area scores from the BASC-3, Teacher Rating Scale, quickly noting that none are in the at-risk or clinical range (although the Hyperactivity score brushes against the at-risk range). Considering SEM, however, the Hyperactivity score is T-score = 60 +/- 5.2. A reasonable interpretation is that this is an average range score. The same is generally true for the adaptive scales, where the scale measuring social skills noses slightly above average. (Note, however, that all of the BASC-3’s Adaptive Scales are arranged with high scores denoting strengths). But considering SEM, the Social Skills score is T-score = 39 +/- 4.8, which may reflect an average range true score as well. In the aggregate, the BASC-3 scores suggest very little social-emotional concern for a student referred for SLD assessment. Thus, Patrick judged this case to represent a legitimate SLD candidate (with no reason for additional scrutiny of emotional disturbance).
Table 5.13 Example of Patrick’s Use of Broadband Scores to Address Possible Emotional Disturbance |
|
|
Behavior Assessment System for Children-3 (Teacher Rating Scales)
|
|
| F index | Acceptable |
| Response pattern | Acceptable |
| Consistency | Acceptable |
|
Scales title |
T-score |
| Hyperactivity | 60 |
| Aggression | 51 |
| Conduct Problems | 51 |
| Externalizing Problems | 54 |
| Anxiety | 39 |
| Depression | 45 |
| Somatization | 43 |
| Internalizing Problems | 40 |
| Attention Problems | 49 |
| Learning Problems | 43 |
| School Problems | 46 |
| Atypicality | 58 |
| Withdrawal | 53 |
| Behavior Symptom Index | 53 |
| Adaptability | 55 |
| Social Skills | 61 |
| Leadership | 47 |
| Study Skills | 47 |
| Functional Communications | 56 |
| Adaptive Skills | 54 |
| General combined norms used | |
Novella Jones and Enigma Smith
Novella Jones is a conscientious first-year school psychologist. During her training, she learned to use multiple sources of information, collected from multiple individuals. So far, most of her cases have concerned the prospect of SLD. Now, however, she has received a student for which there are no academic concerns but clear social-emotional aspects. The school counselor referred the girl to her with a question about the nature of any social-emotional problems. Novella spoke with members of her school’s pre-referral team who okayed an assessment with no current questions about special education. Given these facts, Novella hoped to work comprehensively, thoroughly, and competently. But as her information collection unfolded, she felt stymied by lack of any hypotheses about the nature of her student’s problem(s). Facts of the case follow.
Enigma Smith is a first-grade student. During the initial six weeks of the school year her classroom teacher has become increasingly concerned. Enigma is sometimes noncompliant. For example, she might decline to read orally when told to do so. She has also refused to join group activities. Although she generally gets her schoolwork completed, she expresses little enthusiasm. Sometimes, but not always, she seems to give up quickly. Her classroom teacher has seen temper outbursts, including snapping at classmates whose motives seem to be merely friendly.
Problems also appear on the playground. On two occasions, Enigma has refused to line up with her classmates. This provoked a conflict with a playground aide. The aide viewed Enigma’s actions as disrespectful. She said, “the girl wouldn’t even look me in the eye or answer questions.” On the playground, Enigma’s preference appears to be for solitary play. When observed in the cafeteria, Enigma seems isolated. She may sit near other students without interacting with them. She is a picky eater.
Novella accessed background information. Enigma is the younger of two children, an older brother having no school or behavioral difficulties. Parents are divorced, and she has little contact with her biological father. This is a mixed race-family. Her mother is European-American, and her father is Native American (Lakota). Only English is spoken at home. Family history is negative regarding learning, developmental, or psychiatric problems. Although developmental milestones were mastered on time, Enigma takes a lot of assistance at home. She is reportedly poor at executing activities of daily living. She requires extensive assistance and many reminders, considerations that her mother said did not exist with her brother. She is slow moving and moody in the morning, according to her mother. Positively, she is seen as bright and inquisitive. She catches on to new tasks quickly.
Reviewing this information, Novella scratched her head. None of these facts seemed to hint at any particular explanation. She wondered whether her status as a new school psychologist might represent the problem. Perhaps more seasoned colleagues would look at the same information and begin to envision possible explanations. It was disconcerting that none of these seem to come to her. After much consternation, a couple possibilities finally came to mind, although just why these popped up seemed puzzling. One idea was that the student may express symptoms of autism. Another was that she may have ADHD. Novella knew that broadband rating scales might help. Because these scales sample across virtually all domains of social-emotional functioning, perhaps they would turn up something. Thus, BASC-3 forms were distributed to both the classroom teacher and mother.
Score entry into the BASC-3 online portal proved simple. Afterwards, Novella examined the voluminous printouts for the BASC-3 Teacher Rating Scales and Parent Rating Scales. She was disappointed. No obvious patterns emerged. Knowing that she would eventually append a psychometric summary to her written report, Novella prepared a table summarizing test scores (see Table 5.14). She surmised that seeing all the scores in a single table might help. But she still saw no discernible pattern. This prompted a conversation with a more senior colleague who offered her the following suggestion, “Consult the manual. Then make some kind of scheme for yourself.” Novella took this suggestion to heart. Her notes to herself are included in Figure 5.2. As one can see, she roughed out a checklist of the steps for interpretation indicated in the BASC-3 manual. Checklists, as you learned in Chapter 2, help assure that no critical steps are missed. This is true for the preflight checklists of commercial airline pilots, consequently it might be wise for diagnosticians. In Novella’s case, the checklist guaranteed that no BASC-3 interpretive steps would be overlooked. She then developed a simple system to help her slow down and think (make certain that the Reflective System was employed). This unpretentious rubric consisted of simply placing two asterisks to denote a clinical range score and one asterisk to denote an at-risk range score. One column was devoted to teachers’ scores, the other to parents’ scores. This helped bring things into focus.
Table 5.14 Enigma’s BASC-3 Scores (Student Assessed by Novella) |
||
| Behavior Assessment System for Children-3 | ||
| Parent | Teacher | |
| F Index |
Acceptable |
Acceptable |
| Response Pattern | Acceptable | Acceptable |
| Consistency | Acceptable | Acceptable |
| Hyperactivity | 47 | 64 |
| Aggression | 51 | 66 |
| Conduct Problems | 53 | 52 |
| Externalizing Problems | 50 | 62 |
| Anxiety | 55 | 70 |
| Depression | 64 | 90 |
| Somatization | 58 | 44 |
| Internalizing Problems | 61 | 72 |
| Attention Problems | 59 | 54 |
| Atypicality | 62 | 56 |
| Withdrawal | 73 | 80 |
| Behavioral Symptom Index | 62 | 74 |
| Adaptability | 27 | 28 |
| Social Skills | 34 | 30 |
| Functional Communication | 36 | 35 |
| Leadership | 33 | 37 |
| Study Skills | — | 47 |
| Activities of Daily Living | 40 | — |
| Adaptive Skills | 32 | 33 |
| General combined norms were used | ||
As Figure 5.2 makes apparent, Enigma’s teacher and her parent produced global scores (BSI) suggestive of a significant (but not yet narrowly delineated) emotional or behavioral problem. Next, Novella’s notes suggested that although Enigma’s teacher was concerned about externalizing psychopathology, this prospect was not endorsed by her mother. But how might she resolve these apparent score discrepancies? She realized that if the teacher’s Externalizing Problems composite score was considered in light of a confidence interval, the observed T-score of 62 may fall outside the at-risk range. In fact, at the .95 confidence level, one would see this: T-score = 62 +/- 5.2.
Novella next turned to the internalizing dimension (another composite score) where teacher and parent scores were in greater accord. In fact, both Novella’s teacher and her mother produced elevated ratings (at least in the at-risk range). Moving to more fine-grained analysis and consideration of scores falling under the internalizing umbrella, Novella discovered a modicum of agreement between parent and teacher ratings regarding depression. The teacher endorsed symptoms of anxiety, but Enigma’s mother did not. As often happens when multiple informants are used, agreement is imperfect. This is just part of the reality of using rating scales. The narrower the construct (and thus the fewer items comprising it) the more apt that two raters’ scores diverge. As a case in point, these two raters are in more accord regarding the broader internalizing construct than they are regarding the narrower anxiety construct.
At this point, Novella looked for other noteworthy scale elevations. She found one that seemed to match other case information (Withdrawal), which she jotted down. This elevation made intuitive sense—wouldn’t a child experiencing anxiety or depression (or both) withdraw from others?
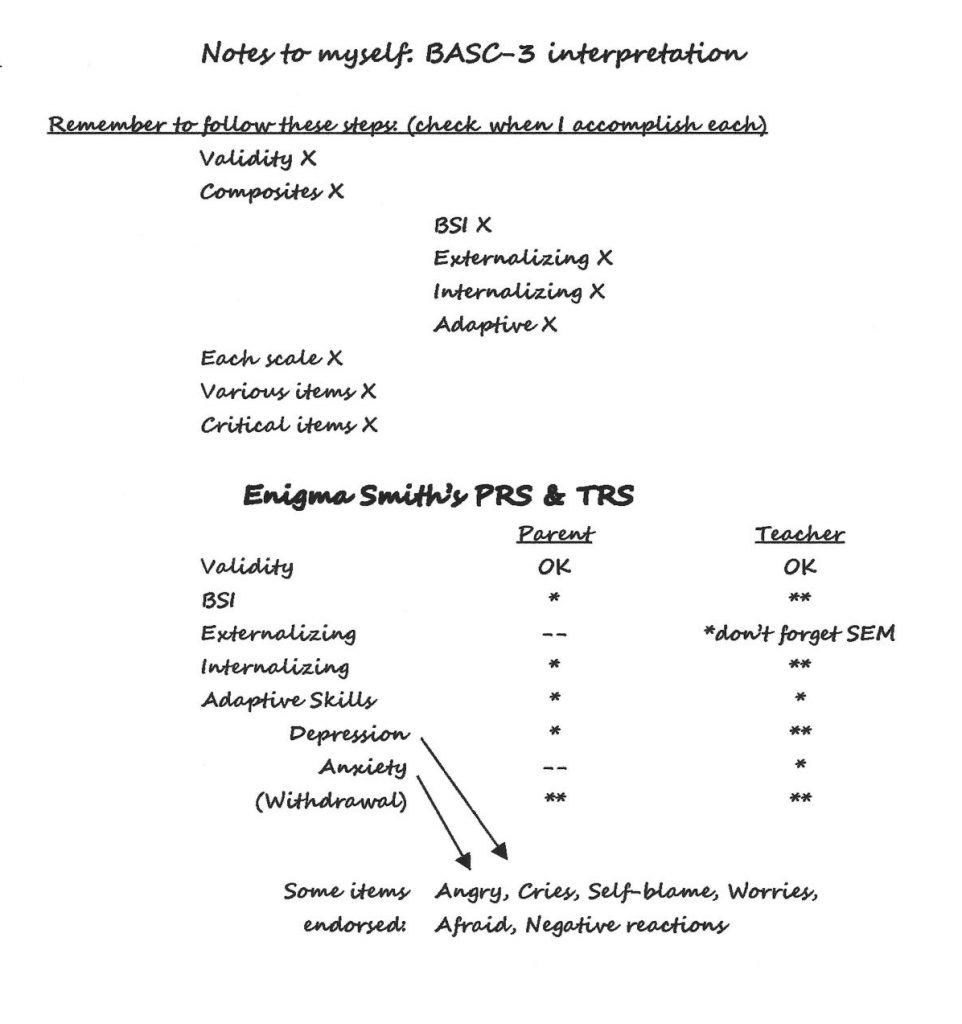
Novella next turned to interpretation at the item level for the Depression and Anxiety scales, as the BASC-3 manual rubric sanctions. Both teacher and parent endorsed symptoms of anger, tearfulness, self-blame, moodiness, and negative reactions. Notes were made regarding some of these. Finally, Novella confirmed that these social-emotional symptoms coexisted with impact on adaptive functioning. Both parent and teacher ratings agreed about wide-ranging adaptive problems. The low Adaptive Skills composite (T-scores = 32, 33) suggested to Novella that the deficits extended across settings.
Novella now felt encouraged. Although the combined parent and teacher ratings failed to provide conclusive answers, they strongly suggested the prospect of significant internalizing problems. Equally consequential, these problems appeared to represent a noteworthy emotional-behavioral problem (not just trivial observations or undo concern on the part of a single stakeholder). What’s more, these emotional-behavioral concerns seemed to result in adaptive problems. This prompted Novella to collect additional information. Her strategy from here was to conduct a personal interview with Enigma, meet with Enigma’s mother for an interview, observe Enigma in class, and speak with her teacher. Novella realized that her hypotheses about autism or ADHD were probably incorrect.
As is often the case when behavioral rating scales are used, Novella’s conceptualizations were nomothetic. She is viewing Enigma status compared to other youngsters. The process is one of judging if Enigma is an outlier, and then to turn to particulars associated with that judgment. Similarly, prior group-level research has revealed the dimensions on which childhood problems might appear and the threshold of significance of each problem type. For nomothetic approaches, norm-referenced rating scales are invaluable. That said, there is no reason to restrict hypotheses to those that are nomothetic. If she were to use the HR Worksheet, Novella could easily consider idiographic hypotheses (e.g., perhaps family stress or Enigma missing her father are contributory). The point is, however, broadband rating scales often prove extremely helpful, and examining them logically and reflectively is advised.
What Might Practitioners Say?
In some ways, broadband scales can be compared to a Swiss army knife (see Figure 5.4). This wildly popular device proves amazingly utilitarian. It can do many things. But it does none of them as well as a tool manufactured for a singular and express purpose. Later chapters address specialized psychological assessment tools, such as narrowband rating scales. These contrast with broadband scales like the Conners CBRS when it comes to identifying, for example, students with autism. The Conners CBRS devotes just 14 items to the detection of autism, much like it uses 7 items to measure social phobia, and 6 items for OCD (Conners, 2010). Compare this situation to the Autism Spectrum Rating Scale (ASRS), a specialized tool that provides 71 items to measure just one of these conditions (Goldstein & Naglieri, 2010). Consequently, vis-à-vis autism detection, the Conners CBRS might be likened to a Swiss army knife. A Swiss army knife can open a can for you in an emergency or trim an errand thread hanging from a shirt. But there are other (specialized) tools that you might also want to own when tasks become more challenging. The same is true regarding broadband scales when you face important decisions.

Summary
Broadband rating scales, especially those completed by teacher- and parent-informants, are extremely popular. In part, their popularity stems from ease of administration, objective format and generation of sophisticated psychometric scores. They are also utilitarian in nature (they serve many different purposes). But readers of this book are encouraged to remember that broadband scales are best used as part of the HR process. Likewise, when school psychologists have access to diagnostic utility statistics, these scales could be used in part to the estimate probability of a particular mental health condition or even an ED designation (i.e., via a probability nomogram). But broadband instruments also require caution. School psychologists are warned against taking scores at face value as well as disregarding reliability statistics. They are also advised about the necessity for full construct representation and avoidance of construct underrepresentation. As valuable as broadband scales are, their adequacy should be scrutinized before initial use and periodically thereafter.