
2 Smart Practice and Avoiding Errors
Key takeaways for this chapter…
- Humans are prone to errors of judgment, and practitioners should know about several of them
- Faulty decisions sometimes occur when a “thinking automatically” rather than a “thinking reflectively” system is used
- A simple tracking form encapsulating emerging hypotheses can minimize errors of judgment
- Once a student is understood via confirmed hypotheses, intervention planning is facilitated
- A system for updating probabilities (a probability nomogram) can minimize errors of judgment
- A checklist can minimize errors of judgment, especially when identifying an educational disability
Cases/vignettes in this chapter include…
- Chelsea Washington, a third-grade teacher
- Reticent Drew
- Franklin, what is the nature of his problem?
- Natalie, abrupt behavior change
- Suzanne Lane and Marie Toussaint, divergent professional opinions
Human cognition is plagued by a build-in glitches that often preclude clear thinking. This means that when school psychologists devise an assessment plan, and later they interpret results, they sometimes act illogically. Pertaining to school psychology practice, many of these distortions are covered in an excellent chapter by Marley Watkins (2009). This chapter is valuable reading for school psychologists who prize rationality and hope to avert mistakes. Many items on the long list of potential judgment errors spring from the vast empirical work of Daniel Kahneman, a professor of psychology at Princeton University. They are summarized in his popular book, Thinking, Fast and Slow (2011). Interestingly, Kahneman’s work won him the 2002 Nobel Prize in Economics. This was the only time that prestigious award was bestowed on a psychologist (Pavlov won in 1904, but he self-identified as a physician). Just a few bias-related concepts are addressed here. Although not yet universally recognized, these concepts are gaining an audience among school psychologists. The following assertion, which appeared in the Journal of School Psychology, seems apt, “All graduate students in school psychology, we believe, must learn about the cognitive errors to which all humans are susceptible…” (Lilienfeld, Ammirati & David, 2012, p. 29). It’s arguable that smart practice depends on such knowledge.
Cognitive Errors (Heuristics)
Let’s look at a few of the long list of cognitive errors (heuristics). After you become familiar with their general nature and think a bit about what they might imply for practice, we will turn to how to manage them.
The Availability Heuristic
The first barrier to logical thinking is this: events (or possibilities) that are easily called to mind tend to seem likely, whereas hard-to-envision events seem unlikely (Kahneman, 2011). Such a tendency exists even when logic would dictate otherwise. The inclination toward this manner of thinking exemplifies a heuristic (an efficient, but not necessarily optimal, cognitive tool). The availability heuristic over the millennia maximized the survival of our hunter-gatherer ancestors, keeping this predisposition strongly represented in the human genome. For example, this heuristic helped assure that a terrifying event etched an intense memory and that memory prompted survivors to envision its recurrence (this is sometimes called the vividness effect). A companion’s death at the jaws of a predator was unforgettable and it served as a valuable cue that hungry predators might be around. No calculation of odds and no deliberate reflection was needed. But in a modern world jampacked with information and electronic means of conveying it (but no saber-toothed tigers), the availability heuristic can prove counterproductive. For example, it is easy for today’s humans to bring to mind terrorist attacks. From time to time, media are filled with detailed (including video footage) coverage. These may run around the clock. Our tendency to effortlessly visualize attacks makes their occurrence in our own lives seem likely. In contrast, statistically more dangerous prospects, like traffic accidents, can be harder to picture. Consequently, the availability heuristic can promote wide-spread concern about terrorists while engendering relatively little logical concern about traffic accidents. Critically, our “thinking fast” brain is incapable of intuiting statistical probability (Kahneman, 2011). Other instances of the availability heuristic abound. Witness the medical student convinced that she suffers whatever affliction was featured in the professor’s daily lecture (e.g., Monday I must have a brain tumor, Tuesday I must have blocked coronary arteries, Wednesday I must have anemia, Thursday…..). The more vivid the example, the more its features are readily visualized, the more recurrent and recent the coverage, the more recallable a possibility becomes. Indeed, giving medical trainees even brief exposure to a few illness-specific facts right before they review case information alters their diagnostic conclusions (Richie & Josephson, 2018).
The same holds true for the availability heuristic and the practice of psychological assessment (Suhr, 2015; Wilcox & Schroeder, 2015; Watkins, 2009). In school practice, some explanations are easily recalled, others not. Consider a school psychologist just back from a workshop on bullying. If the workshop featured detailed cases and video clips, not just statistics, recallability can soar. This is even more true if the school psychologist reviews the workshop for their colleagues (e.g., details for them how bullying is both widespread and profoundly consequential). For them, the next student they assess may result in vivid thoughts of bullying crowding into conscious awareness. Conversely, another explanation (e.g., a history of trauma) may receive no consideration; it simply never gets called to mind. Parallels exist with autism spectrum disorder (ASD) and schizophrenia. The former is now covered ubiquitously in workshops, scholarly publications, specialized diagnostic techniques, parent advocacy groups, and popular books. Not so for schizophrenia. Yet schizophrenia is nearly as prevalent as ASD in high school settings and potentially just as devastating (CDC) https://www.nimh.nih.gov/health/statistics/schizophrenia.
Confirmation Bias
Better known than the availability heuristic, confirmation bias involves the predisposition to seek information that confirms pre-existing beliefs. It is intensely relevant when assessing children (Shur, 2015; Watkins, 2009; Frick, Barry & Kamphaus, 2010; Lilienfeld, Ammirati & David, 2012). For school psychologists, the bias may emerge as initial hypotheses remain tenaciously held, whereas rival hypotheses get short shrift. Importantly, confirmation bias often operates unconsciously. It might appear as unrecognized attention to hypothesis-congruent background information or over-focus on hypothesis-congruent classroom conduct. Similarly, a school psychologist might unwittingly pose interview questions that boost her existing diagnostic position while forgoing questions that might reveal an alternative possibility. Just this has been found in forensic practice (e.g., child abuse cases). Here, some interviewers fall prey to confirmation bias by posing leading questions in lieu of open ended (and potentially disconfirming) inquiries (Powell, Hughes-Scholes & Sharman, 2012). Even patterns of psychometric test scores risk misinterpretation—minimally elevated scale scores may seem more higher than they really are when they match the diagnostician’s prior case conceptualization. Research documents that confirmation bias can exist even in fairly elementary visual perception tasks (Rajsic, Wilson & Pratt, 2015). Obviously, objective truth in general is threatened by this bias. Social-emotional assessments, which may contain unavoidably nebulous elements, seem particularly ripe for confirmation bias.
The perceptive reader might have noticed that the availability heuristic and the tendency for confirmation bias are inter-related. After a school psychologist begins to collect and think about assessment information, she often experiences easy visualize of her emerging case conclusions. This fuel can ongoing confirmation. Concomitantly, other candidate explanations become less readily visualized. As with the availability heuristic, confirmation bias is best managed first by recognizing its existence followed by application of a structured technique that can help assure equitable consideration of rival explanations. Broadly speaking, this works best when critical thinking is coupled with an open-minded problem-solving style. Julia Galef (2021) writing in the popular press calls this the “scout mindset,” analogous to a scout whose survival depends on seeing things just as they are while continually challenging pre-existing assumptions. Marley Watkins (2009) writing for school psychologists argues that is it is preferable to adopt the role of inquisitive detective, scrupulously following all leads, over that of a defense attorney, doggedly arguing for what she already has decided is true.
Fundamental Attribution Error (FAE)
FAE is another practice-relevant cognitive distortion. It is especially meaningful in the context of schools, where situational influences are plentiful. FAE is our tendency to attribute others’ actions to internal characteristics and dispositions instead of contextual causes (Hooper, Erdogan, Keen, Lawton & McHugh, 2015). Chelsea Washington, a third-grade teacher, is assigned to playground duty during the first week of the fall semester. She soon notices one boy’s conduct. This lad repeatedly knocks down a classmate and then, temper flaring, screamed loudly. Chelsea’s thoughts are as follows: “What an aggressive, angry young man.” In doing so, she attributes his actions to his core personality, an enduring characteristic of the student. By the third day of recess duty, Chelsea’s patience has worn thin. Worse, she has developed a migraine that might have been prompted by a dead car battery. She was eventually late to work. After all of this, Chelsea finds herself raising her voice on the playground and irritably threatening to punish a mildly disruptive fourth grader. She thinks to herself, “Nothing is going right, no wonder I’m having a bad day.” FAE includes the notion of explaining our own actions in terms of situational causes, the exact opposite of the attribution overemphasized to make sense of others’ actions. Chelsea was aware of, and used to contextualize her actions, the events surrounding her own “bad day.” In contrast, she was blind to the student’s world, which might have included bullying in the moments before he headed out to recess, a bad night’s sleep, or a negative history unique to this classmate.
Even highly important situational factors are sometimes ignored. Wilcox and Schroeder (2015) suggest that homelessness, with the capability for overwhelming impact in all spheres of functioning, may be neglected in favor of attributing a student’s failure to the presence of a disability. Homelessness concerns something situational as well as something external to the child; disabilities are enduring and internal to the child. By the same token, poor progress on a student’s behavior plan might be blamed on characteristics of the student herself (maliciousness, laziness) rather than to flaws in the school psychologist’s behavioral program or poor plan implementation. Risks of FAE are widespread in the schools.
Representativeness Heuristic
Let’s take a step back. Consider the following example. Walking across a college campus, you encounter a nervous young man who asks you for the time. He seems remarkably ill at ease, makes limited eye contact, and speaks in a barely audible voice. Here’s your challenge. Is this individual (Tom W.) more likely a PhD student in mathematics or a student matriculated in the business college? Most people guess that he is a math student. In doing so, they have focused on salient aspects of his presentation (i.e., Tom W.’s social awkwardness). Without reflection or conscious awareness, Tom was envisioned as a math PhD student. This is so because his style and manner is representative of many people’s image of someone studying advanced mathematics. This is the representativeness heuristic in action. The representative heuristic involves matching a particular individual with a stereotype (Kahneman, 2011). Here’s the important point–this heuristic may lead diagnosticians to make mistakes (Frick, Barry & Kamphaus, 2010) Included are school psychologists conducting social-emotional assessments (Watkins, 2009; Lilienfield, Ammirati & David, 2012).
Base Rate Neglect
The representativeness heuristic can sometimes prove so powerful that it also blinds diagnosticians to essential facts. One of these is so called “base rate” (and overlooking base rate can be termed “base rate neglect;” Bar-Hillel, 1980). If you selected the PhD in math option in Tom W.’s case, then you ignored the local prevalence of math PhD students and members of the business college. With a little reflection, it’s clear that on nearly all campuses that business students outnumber their advanced math student counterparts. In other words, the campus-specific “base rate” of PhD math students is nearly always much lower than the campus-specific “base rate” of business students. Thus, setting aside for a moment personality style considerations for any particular student, one is simply much more likely to encounter a business student. But what about Tom W.’s obvious personality style? Logically, this needs to be considered as well. You will see later in this chapter a method of combining two pieces of critical information that precludes base rate neglect. For now, it’s important simply to recognize that the automatic, thinking fast, system prompts snap judgments based on stereotypes, leaving behind all the advantages of careful analysis including those related to base rates.
What You See Is All There Is (WYSIATI)
A remarkable aspect of human cognition is our inability to readily conceptualize (surmise, visualize, contemplate) thing we have not encountered. Correspondingly, our immediate thinking is strongly swayed by things we have witnessed. Consider the following description of a third-grader named Drew. It was written after a first and only encounter with a school psychologist who was conducting IQ testing. “Drew was extremely quiet. Every effort to engage him in conversation was a struggle. Once he started to talk, he had little to say.” Now consider this simple summary question, “Do you think Drew might have limited conversational skills?” It seems that the answer is “yes.” This facile conclusion reflects a human tendency to apply WYSIATI (Kahneman, 2011). Critically, WYSIATI happens and we don’t even know it. Equally troubling, humans may have no urge to seek more information once they witnessed something meaningful. Well-trained school psychologists, of course, would likely seek more information before reaching conclusions about Drew’s conversational skills. They recognize that what they have seen is not all that there is. But their doing so reflects professional training that counters a hardwired human tendency toward WYSIATI.

Why is this important in practice? Practitioners are continually operating with only part of the vast universe of potential facts, scores, and observations that could help paint a complete student portrait. Facing those limitations, we necessarily construe reality as best we can. In Drew’s case, if just another piece of information were available, things might be interpreted quite differently. For example, if Drew were observed chatting in class or effectively expressing his playground preferences, an alternative conception might emerge. The same may well be true in the presence of an average range BASC-3 Functional Communication score. As you will see later in Chapter 8, WYSIATI can represent a terrible problem when school psychologists conduct single-session classroom observations. That said, WYSIATI is apt to create real threats to accurate judgements anytime an important decision is made with limited information. And, our minds often pull us toward snap conclusions with scant information.
Racial/Ethnic Bias (Stereotyping)
The word bias appears recurrently in this chapter. But what about the meaning of bias that is more familiar to the lay public—biased views and stereotypes that one group holds regarding another? Well, it’s fairly easy to envision how the representativeness heuristic (recall the example of Tom W.) might also come into play in the context of thinking about those from other racial and ethnic groups. When unconscious this represents implicit bias. When conscious it is akin to simple prejudice “holding negative feelings toward a group and its members or exhibiting hostile and negative treatment directed at a group and its members” (Levy, Shin, Lytle & Rosenthal, 2017, p. 237).
We all know that racial stereotypes are common. As a case in point, when a group of California teachers’ racial beliefs were ascertained via a questionnaire, stereotyped thinking was indeed confirmed. Teachers’ responses revealed the following racially stereotyped views: Black students (relative to Asian and White students) tended to be seen by these educators as “aggressive” and “lazy.” Conversely, Asian students (relative to White and Black students) tended to be seen as “gentle” and “industrious” (Chang & Demyan, 2007). Again, racial stereotypes need not enter conscious awareness (the potentially unconscious character of such biases has been acknowledged for at least a quarter century; see Greewald & Benaji, 1995).
Findings like these are hardly surprising to most school psychologists, although one’s own susceptibility to stereotypes may go unrecognized. The practical question, of course, is what should be done with troubling information like this? You will see in Chapter 4, whenever an “ethnic incongruence” exists between a school psychologist and a student/family (e.g., Loe & Miranda, 2005), then case-specific vigilance and revised school psychology practices may be needed. Similarly, you will learn in Chapter 5 that alternative norms might warrant consideration when interpreting parent-completed rating scales. For the moment, however, it’s appropriate to reflect on one source of stereotypes–limited cultural awareness and poor cultural sensitivity. In other words, stereotypes and prejudice may spring from limited familiarity with other racial and ethnic groups. If this is true, then training in cultural awareness may represent a partial remedy. Regarding this prospect, a small, mixed-methods study suggests that a five-week multicultural course helps school psychology graduate students to become “ethnoculturally empathic” (Vega, Tabbah & Monserrate, 2018). Enhanced awareness of cultural factors that affect professional practice was also documented among varied professionals engaged in a brief (i.e., three hour) workshop (Verdon, 2020); some changes were documented to persist a year later. A more far reaching solution, reducing unconscious-intuitive thinking to prevent errors of diagnostic decision making, is provided immediately below.
Smart Practice Starts with Taming Our Irrationality
These heuristics can lead school psychologists to errors of diagnostic decision making. Equally troubling, they often engender overconfidence. In fact, overconfidence and blindness to our own vulnerability to errors is a risk that both novices and seasoned practitioners share. You will see many more examples of these cognitive distortions and their practical effect in the pages ahead. But how do we make conceptual sense of this mixed bag of heuristics? What is their genesis? Fortunately, Kahneman (2011) has provided a foundation. It involves two hypothetical systems resident in the human brain. System 1 has these characteristics:
- fast
- low effort
- unconscious
- selected by default
In contrast, System 2 has these characteristics:
- slow
- effortful
- conscious
- invoked only when System 1 fails or when external prompts call it to action
Kahneman’s terms and his conceptualization are now widespread. For example, when researchers seek to understand diagnostic reasoning and devise ways to minimize errors, they often rely on this very “dual processing” model (Monteiro & Norman, 2013). Like Kahneman’s popular press book, another volume by Thaler and Sunstein (2009) offers guidance about human decision making. One of the authors, Richard Thaler was a former colleague of Kahneman and himself the 2017 Nobel Prize winner in Economics. Thaler and Sunstein have adopted terms that most readers find easier to use than those of Kahneman: System 1 is referred to as the “Automatic System” and System 2 is referred to as the “Reflective System.” We will use these easier terms thorough the rest of the book.
The Hypothesize and Revise (HR) Approach
Wise diagnosticians often approach the assessment process with a blend of open-mindedness and skepticism. In this sense, they are like scientists seeking to understand the nature of the physical world. In the scientific process, empirical findings and pre-existing theory (plus associated hypotheses) suggest which candidate explanations are best supported. Researchers’ explanations, however, are recognized to represent inferences, conceived by humans, not fixed reality. Hypotheses are scrutinized, their veracity strengthened or weakened, more data are collected, and the hypotheses are again scrutinized. The process is reiterative. What is believed to be true is always provisional. In the final analysis, best judgments are made to fit all the data. Research scientists can be pretty sure about the reality of things, but they can never achieve absolute certainty.
The assessment process can be envisioned the same way. Well executed, it involves testing of hypotheses (Wilcox & Schroeder, 2015; McLeod, Jensen-Doss & Ollendick, 2013) and it comprises steps (Suhr, 2015; Frick, Barry & Kamphaus, 2020). Consequently, it is often helpful for school psychologists to don the hat of a social scientist. After the referral question, most school psychologists begin to formulate hypotheses about what is going on, not unlike their researcher counterparts. Practitioners’ hypotheses may include those that are idiographic (concern the uniqueness of the student and her circumstances). Idiographically-oriented examples include inferences about personality dynamics, mismatches between student characteristics and educational demands, teacher or parent over-concern (faulty referrals). Alternatively, hypotheses can be nomothetic (concern understanding a student by virtue of placing them in a category about which information is already known from many individuals). Nomothetically-oriented examples include assigning a student to a mental health category, such as depression or ADHD.
To minimize errors, caution is advised when collecting, organizing, and interpreting psychological information. Think about just two heuristics considered earlier–the availability heuristic and confirmation bias. With only these two threats lurking, most school psychologists are better off with a structured method. A fixed procedure, especially if linked with tangible decision-trees or printed forms requiring thoughtful completion, can help skirt the Automatic System of thinking and concomitantly summon the Reflective System. This makes sense because it is challenging to weigh and integrate all sources of information (a task well suited to the Reflective System but ill suited to the Automatic System).
A simple structured approach is advocated in this book. It promotes reflection as it helps you organized diverse information. We start with the practitioner-friendly, qualitative methodology called the Hypothesize and Revise (HR) approach. You will see the HR approach come to life in via a simple case, a student named Franklin. You will have additional opportunities to practice the approach in the chapters ahead. Although it is eclectic and flexible, the HR approach is best suited to referral questions calling for a comprehensive understanding of referred students.
The HR process unfolds sequentially, in steps. How to complete each step is summarized in Table 2.1 (you might want to bookmark this table or copy it if you are just starting out). The key idea is that all information receives careful, reflective review. Concomitantly, the school psychologist uses her skills and insights to locate important information and to separate the relevant from the irrelevant. To assure all candidate hypotheses receive sufficient consideration, working hypotheses are written explicitly on the HR Worksheet. This practice helps prevent over-focus on any single explanation. As you will see in the case of Franklin, evidence supporting and contraindicating candidate hypotheses is written on the HR Worksheet in bullet points. Bullet points, in turn, help document the school psychologist’s thinking as she considers her case. The method as a whole supports the evaluation process and makes it easier to keep track of growing and shrinking confidence among rival hypotheses. To help systematize your current confidence in each hypothesis, the HR Worksheet includes a Likert-type rating system. This means that each rival hypothesis, at each stage, receives a rating between 1 and 5. School psychologists typically follow various stages moving from Initial, to Middle, to Final by assigning updated ratings as they go. As Table 2.1 indicates, the Middle stage comprises several sub-steps (i.e., record review, observation, etc.) each of which may or may not come into play, depending on the particulars of the referral question plus what is found along the way.
Table 2.1 Steps in Completing the HR Worksheet |
|
Getting Started
|
| Enter demographic information at the top of the page. In general, the HR Worksheet is completed one stage at a time over several days, although completion in a single sitting is possible if all assessment information has already been collected. |
|
Initial Stage
|
| At this stage, review the referral question as well as initial concerns expressed by school personnel and/or parents. After doing so, list working hypotheses (top of the Worksheet) plus numeric ratings of your confidence in each. This early in the process, you will probably list only a couple hypotheses. At this stage, these are likely to receive ratings of “possible” or “probable” (i.e., 3 or 4). It’s often helpful to list “No true emotional or psychological problem” as a working hypothesis. If you do not list one here, you will be prompted on the last page of the HR Worksheet to confirm that this possibility was indeed considered before you reached a final conclusion. As you work, be sure to consider cultural and linguistic factors as well as other threats to validity; check off associated lines in the upper left corner to confirm that you actually considered these factors. Similarly, try to consider both nomothetic and idiographic hypotheses (footnotes help you remember these terms); check off associated lines in the upper right corner to verify that you thought about both types of hypotheses. Pencil in supporting evidence in bullet form under each hypothesis. Also, pencil in contradictory evidence (evidence that would speak against a hypothesis). If you surround your contradictory findings with parentheses, they will stand out more clearly from supporting facts, which can speed your final review and facilitate report preparation. Student strengths or supports detected now or at any stage in the process can be noted on the back page of the HR Worksheet (i.e., under the heading “List student’s Strengths and Supports”). |
|
Middle Stage A
|
| Review school information, such as found in teachers’ comments, work products, cumulative record, report cards, and screening measures. Also, speak with the student’s teacher to determine his/her level of concern, perceptions on the nature and severity of any perceived problem as well as potential causes or contributors. Then, assign revised values (1 – 5) to each hypothesis. Use the same method of recording supporting (and contradictory) evidence used in the Initial Stage. Add new hypotheses, if necessary. Make another column in the margins of the worksheet if you run out of room to list your hypotheses. Once again, check all necessary boxes to confirm no important cultural or linguistic factors or threats to valid assessment were overlooked. Do the same regarding verification that at this stage both nomothetic and idiographic hypotheses were considered and that the base rate issue was considered. |
|
Middle Stage B
|
| Review home, family, and developmental information. Try to conduct a parent interview. List new supporting evidence. Then assign revised values to each hypothesis as well as new supporting evidence. Add new hypotheses, if necessary. At this stage, some diagnosticians routinely eliminate hypotheses with ratings of 1, (with the prospect of resurrection as new information is collected), although continuing to list and contemplate all hypotheses can help avoid confirmation bias. Again, check all necessary boxes to ensure no important considerations were overlooked and that both nomothetic and idiographic hypotheses were considered. |
|
Middle Stage C
|
|
Consider findings from the use of broadband rating scales (e.g., BASC-3). This may include teacher, parent and self-report options. You can list formal tools used at this stage, as doing so often facilitates report preparation. With findings in hand, assign revised values to each remaining hypothesis. This might be done by, for instance, updating values after reviewing teachers’ rating only, then parents’ rating, then self-rating, or by examining all simultaneously. List new supporting evidence. Add new hypotheses, if necessary. At this stage, hypotheses with values of 1 might be eliminated. Continue to check all necessary boxes to ensure no important considerations were overlooked at this stage.
|
|
Middle Stage D
|
|
Consider findings from observations as well as interview of the student (the length and complexity of this step varies according to your existing hypotheses). A form entitled Teacher’s Guidance for Classroom Observation can help assure that observations are timely and targeted. Regarding student interviews, novice diagnosticians are encouraged to follow a format so as not to miss important (and obligatory) topics. The form entitled Generic Child Clinical Interview provides one such format. Add new hypotheses, update the evidence list and check necessary boxes, as before. At this stage, hypotheses with values of 1 might be eliminated.
|
|
Middle Stage E
|
|
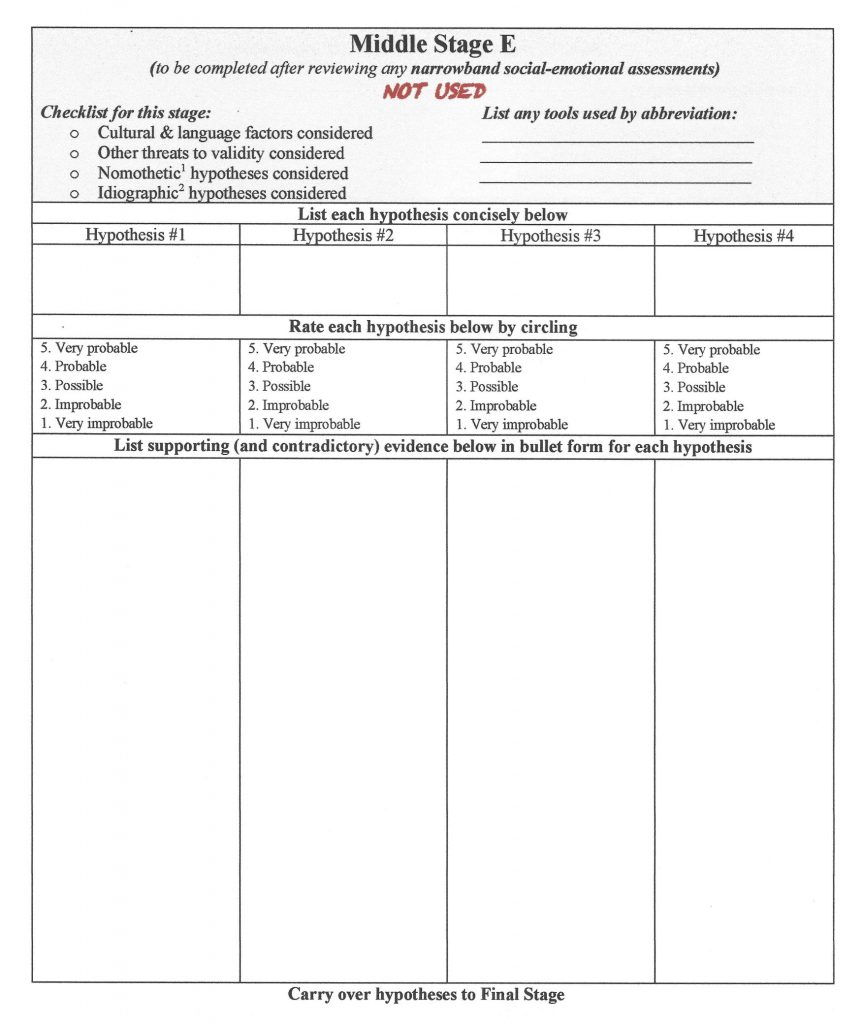
Now consider narrowband scales (e.g., Revised Children’s Manifest Anxiety Scale-2; ADHD-5 Rating Scale). Narrowband scale use, however, is often confined to hypotheses that retain ratings of 4 or 5 after Middle Stage D. Middle Stage E is sometimes omitted in the absence of acceptable narrowband scales or if one or more hypothesis has already garnered a rating of 5. If narrowband scales are used, it is helpful to list them by name to aid in subsequent report preparation. Add new hypotheses, if necessary. Continue to list evidence and assign point values. Hypotheses with ratings of 1 are retained or eliminated at the diagnostician’s discretion. Check all necessary boxes yet again to ensure no important considerations were overlooked.
|
|
Final Stage
|
| List all supporting (and contradictory) evidence, in bullet form, associated with your final conclusion. This summarization of evidence is typically restricted to those hypotheses with final ratings of 4 or 5. Sometimes, more than one highly rated hypothesis remains (this might reflect comorbid conditions, like the joint occurrence of ADHD and ODD or depression coupled with situational frustration in certain classes). If “no true emotional or psychological problem” is the final summary conclusion, then idiographic explanations should be carefully considered. This includes an explanation of how the case reached the referral stage. Check all necessary boxes to ensure a final time that no important considerations were overlooked (and that you indeed considered “no true emotional or psychological problem.”) |
| After the Final Stage of Hypothesis Examination |
| Depending on your job responsibilities and the referral question, now consider administrative designations (not just the important idiographic and nomothetic hypotheses addressed so far). Because most administrative designations contain explicit criteria, a checklist is generally the best method to use. Several options are listed on the HR Worksheet (e.g., pertaining to OHI or ED). To assure that you have considered this responsibility, check the appropriate yes/no choice in each column and then use any necessary checklists of your own making or those already prepared by others. Finally, add to back page any other case notes (this same section might be filled out as you work through the various stages of assessment). |
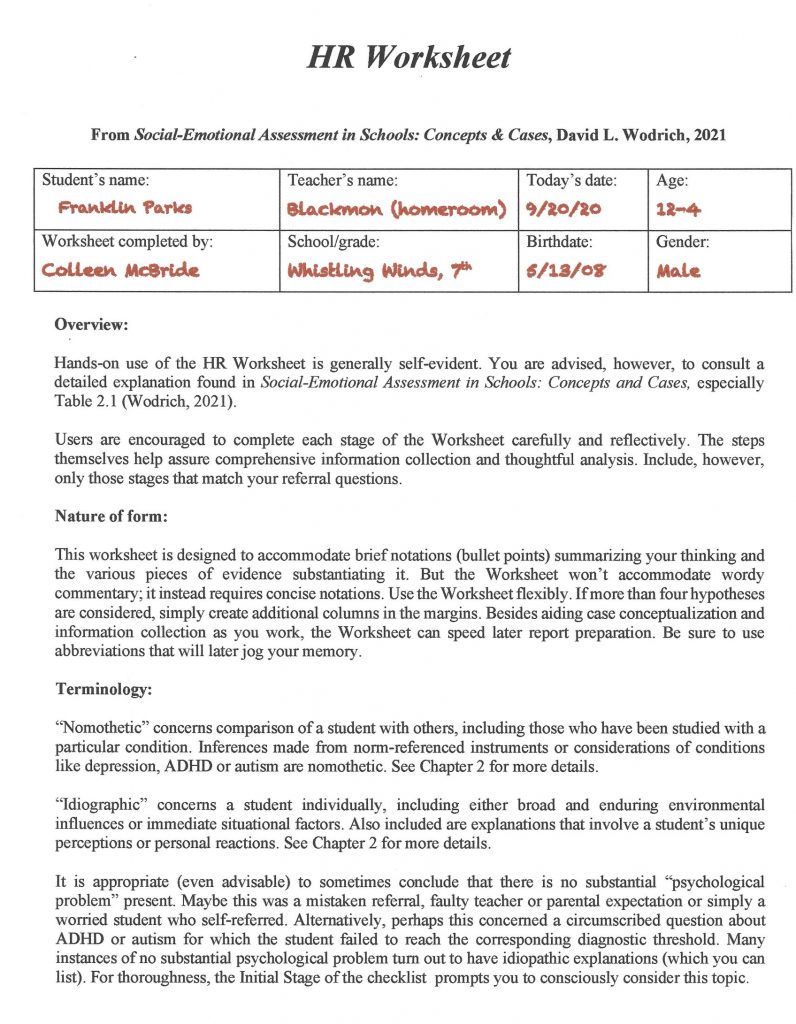
Now let’s take a closer look at Franklin and the HR Worksheet. It was completed by his school psychologist, Colleen McBride. To keep things simple, each of the 10 pages of the HR Worksheet is considered separately in their correct order. The front page of the HR Worksheet (Figure 2.2) simply conveys basic facts and provides you tips on using the form. Fill this out to start the process.
The Initial Stage (Figure 2.3) is where things become more interesting. As you will see in more detail in Chapter 3, the assessment process practically (or at least conceptually) begins with a referral question(s). In the example of Franklin, a background sketch accompanied his referral question, and it might have suggested hypotheses right from the outset. For example, his teacher wrote on a referral form that, “Franklin seems increasingly pessimistic and unmotivated in class.” Further, the referral from his teacher asks, “What might be causing this to appear? Might he need assistance, accommodations, or perhaps special services?” Even a brief interview with a referral agent (e.g., one of Franklin’s teachers) can suggest hypotheses. In this case, assume that the referring teacher mentioned signs of sad mood and that Franklin seems “changed” over the past few weeks. This information could prompt one or two initial hypotheses, which one can see were jotted down in the second and third columns of the HR Form. For example, one plausible initial possibility is the emergence of recent onset stress, either at home or at school. Another possibility is an emergent depressive disorder. Everyone sometimes feels stuck coming up with hypotheses. Appendix A provides a list of some possibilities to help you.
It is interesting that one of these hypotheses is idiographic (about Franklin uniquely), the other nomothetic (Franklin as one instance of a previously-recognized condition [depression]). The HR approach is designed to accommodate either perspective. Besides these two hypotheses, Colleen wonders if there really is a psychological or behavioral problem (perhaps Franklin’s behavior and mood is simply typical for a 12-year-old). Consequently, she lists “no psychological problem” among her set of initial hypotheses. As seen in Figure 2.3, Colleen selected a value of 3 (“possible”) for each hypothesis listed in the Initial Stage. She moves forward into later stages of her analysis retaining these three working hypotheses.
You can see that the very use of the HR form provokes the Reflective System. It’s unacceptable to list just a single hypothesis, even at the beginning of case formulation. Also note that at the Initial Stage Colleen was prompted to consider cultural and linguistic factors, as well as other threats to validity (e.g., untrustworthy informants, invalid rating scale scores). Similarly, she was prompted to consider both nomothetic and idiographic explanations. Finally, she was asked to consider how commonly or how rarely her various working hypotheses might exist in her work setting. This is an antidote to base rate neglect. In brief, many of the challenges to accurate assessment raised in Chapter 1 are addressed simply by employing the HR Worksheet.
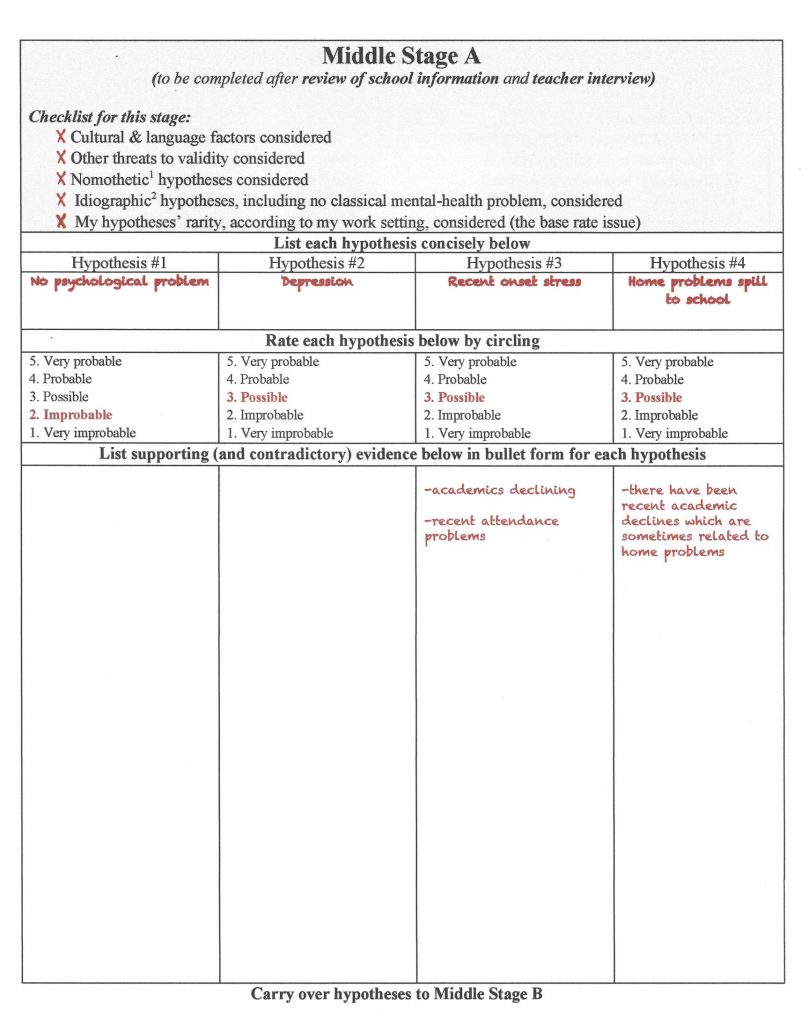
The Middle Stages found in the HR Worksheet can be sequenced however you like. A standard order is indicated here. For illustrative purposes here, it commences with Middle Stage A and review of school information (Figure 2.4). Table 2.1 offers details about what is included in a review of school records, and you will learn much more about how to execute this stage in Chapter 4. Let’s assume that Franklin’s school records are generally benign. That is, it appears he is free of health problems, has passed hearing and vision screenings, has had satisfactory group achievement test scores, success on academic probes, and adequate report card marks. This was true until he recently entered seventh grade. Academic decline and diminished attendance then surfaced (apparently relatively suddenly). Perhaps because it remains early in the school year, however, an interview with Franklin’s home room teacher (Ms. Blackmon) failed to confirm changes in his school performance.
Now back to the working hypotheses. This thumbnail sketch might serve to perpetuate the prospect of depression (holding its rating at 3 “possible”), as well as recent onset stress (similarly maintaining its rating at 3 “possible”), as you see in Figure 2.4. School records might also suggest a new hypothesis—problems at home that spill over into Franklin’s schoolwork. Colleen also assigned a rating of 3 to this hypothesis. Again, Colleen would pencil in the existing and new hypotheses (“home problems spill to school”) as she moves down her HR Worksheet. In light of mounting information, it seems less likely that Franklin is problem free. Thus, the rating for the “no psychological problem” hypothesis is revised to a 2 (“improbable”). Colleen again completes the “Checklist for this stage,” assuring the enumerated considerations were not forgotten.
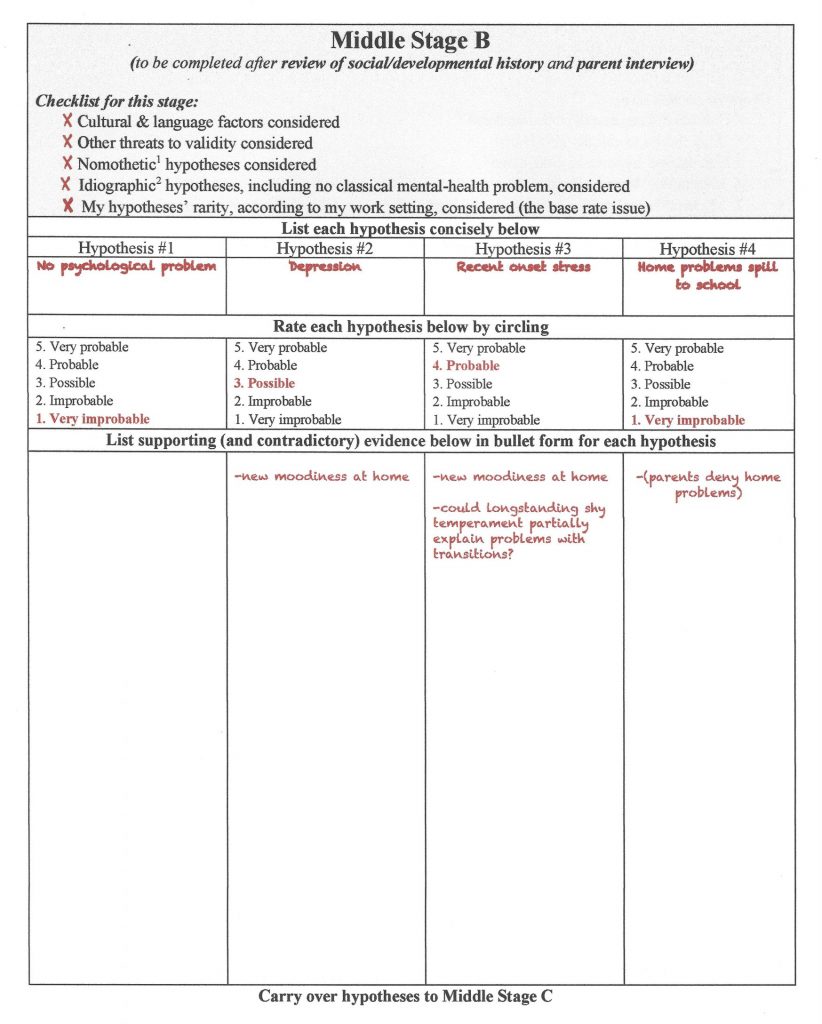
Next comes home and developmental information (Middle Stage B), often including face-to-face or phone interview of parents/caregivers (see Figure 2.5). Critically, Franklin’s parents reported an absence of stresses or dramatic changes in their home. Searching disconfirming information (remember the risk associated with confirmation bias), Colleen explores this topic in depth. She does so by securing parents’ trust, convincing them that their honest responses might help their son and by using systematic (not superficial) inquiry. But even with the most thorough questioning, parents reveal nothing about home that might explain their son’s recent school difficulties. On the other hand, Franklin’s parents did characterize their son as becoming increasingly isolated and more moody. The rest of parental disclosures seemed minimally relevant, save for the off-hand comment that Franklin has always appeared shy. To this same point, they described their son as often uncomfortable with novelty and averse to changes of routine.
This updated information is sufficient to weaken the “home problems spill to school” hypothesis (now rated as 1, “very improbable.”) Note that disconfirming information is entered in parentheses, as you see in the far right column under Hypothesis #4. Parentheses makes locating counter-evidence easier to find if in needs to located later in case formulation or report preparation. Colleen judges that the “depression” hypothesis, however, remains plausible (thus retaining a rating of 3 “possible”) because parents confirmed that Franklin has recently seemed moodier at home. According to Colleen’s thinking, the “recent onset stress” hypothesis also remains viable. In fact, new-found facts seem to have strengthen it a bit, even if the presence of longstanding shy temperament seems to speak against it (note the parenthetic notation of shy temperament in column #4). Colleen now concludes that Franklin is not problem free (i.e., she eliminates the hypothesis in column #1).
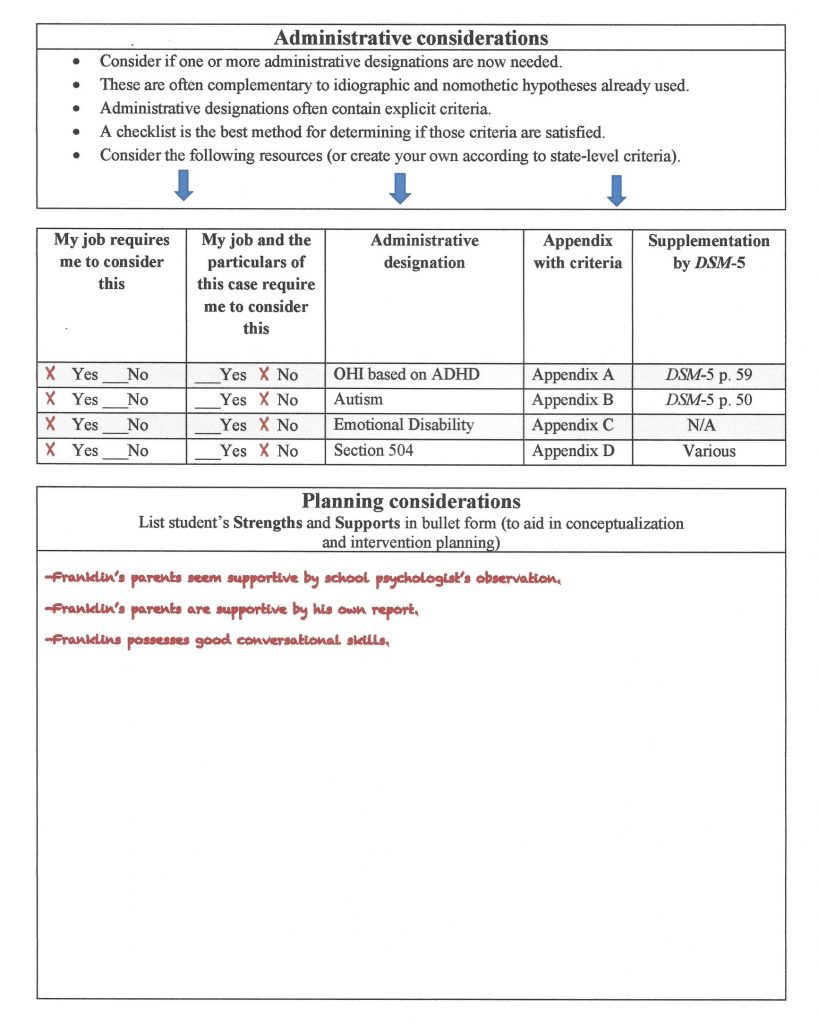
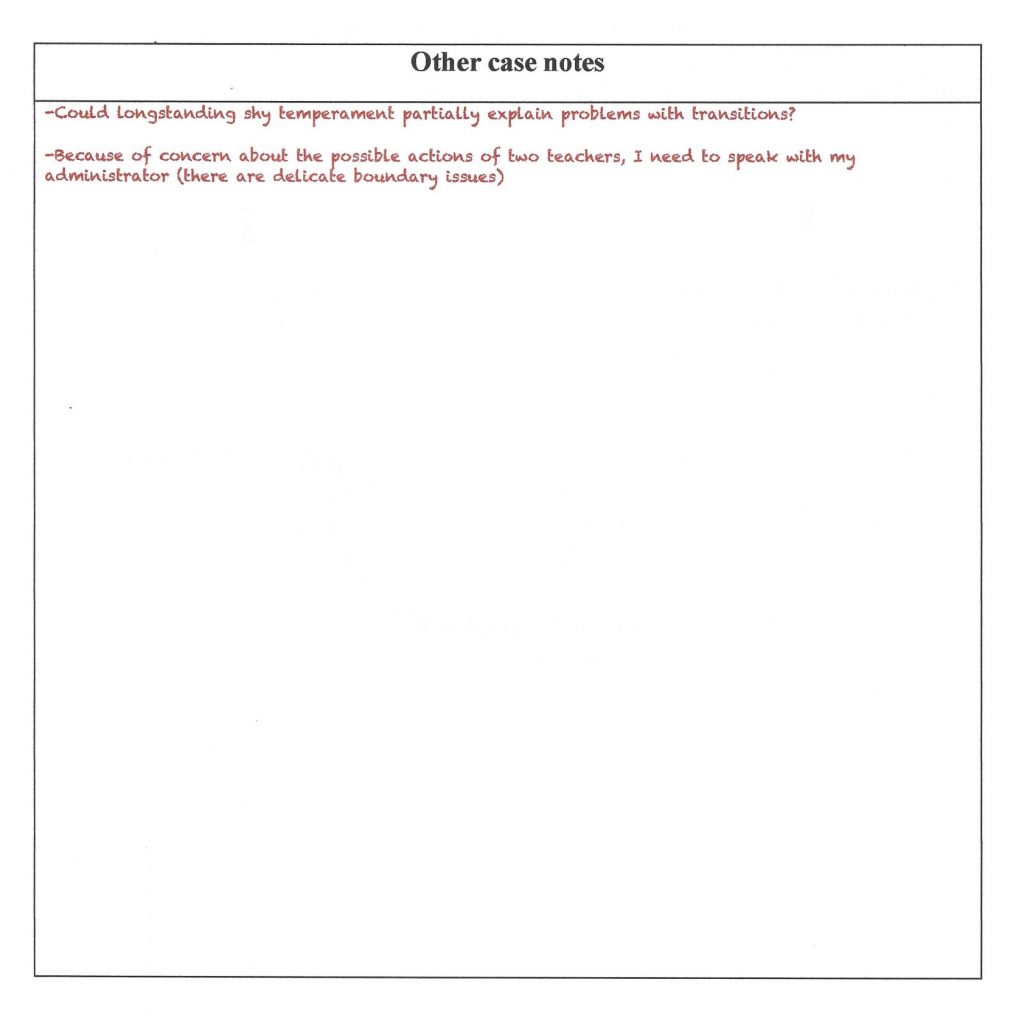
At this point, Colleen’s formulation becomes a bit more nuanced. She speculates that Franklin is constitutionally shy and that his shyness prompts discomfort during each school transition, such as moving among classrooms. It turns out that the seventh grade in Franklin’s school is the first year when a single homeroom teacher is supplanted by departmentalized instruction (and many more daily transitions). This fact may partially explain Franklin’s presenting problems. Accordingly, a value of 4 (“probable”) was assigned to the “recent onset stress” hypothesis. Colleen added the supporting information and a question to herself in bullet form (“Could longstanding shy temperament partially explain problems with transitions?” You might also note regarding Middle Stage B that Colleen was impressed that Franklin’s parents are both cooperative with the fact-finding process and supportive of their son. Consequently, she printed that “Franklin’s parents seem supportive” (an asset for him) on the section of the HR Worksheet entitled “Planning Consideration—Strengths and Supports.” You can see her notes if you scroll ahead all the way up to Figure 2.11, which provides space for case notes. She also jotted down in a question to herself about Franklin’s shy temperament, in case that information is needed later.
Many school psychologists would next use one or more broadband scales. These might include, for example, rating forms completed by Franklin’s parents and one or more of his classroom teachers (e.g., BASC-3). Franklin might also have completed a broadband self-report scale (or personality inventory). Colleen decided to forego use of such tools because she judged that she could address the current rival hypotheses without them. Thus, Middle Stage C remains essentially uncharged (see Figure 2.6). For many (most) of the students you work with in the field, however, additional and updated information will occur at this stage. (Incidentally, you will learn much, much more about broadband scales in Chapters 5 and 6).
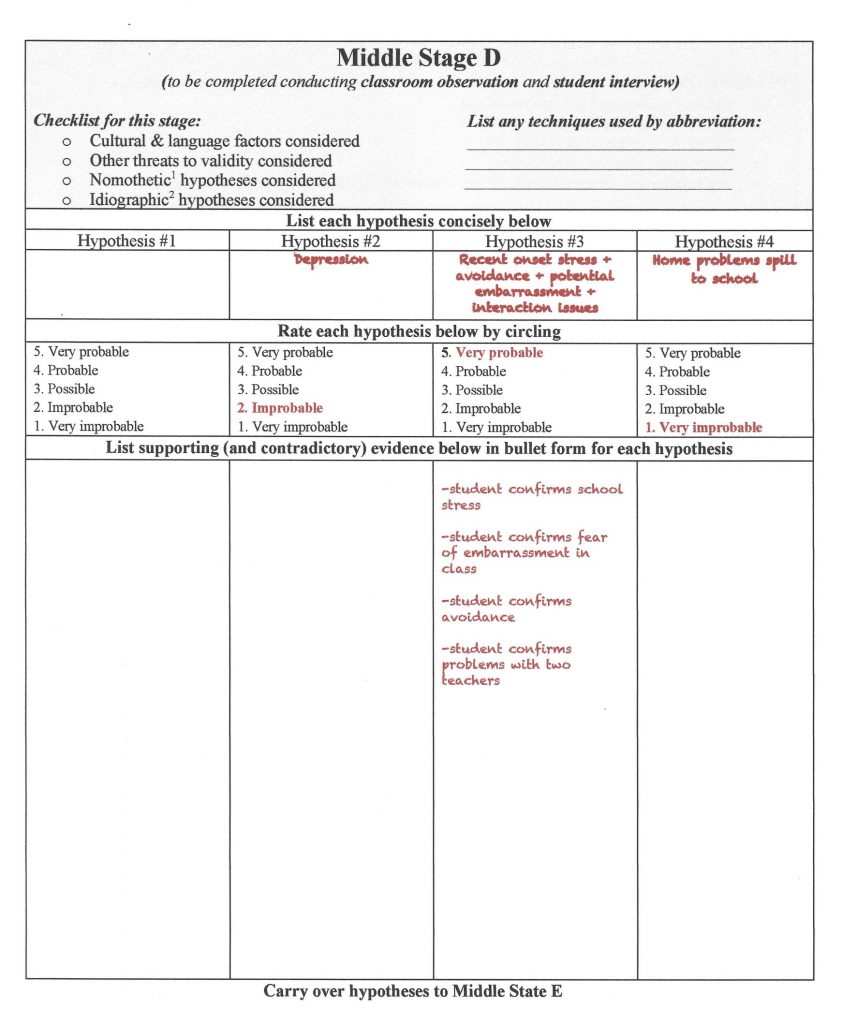
Colleen came next to two important tasks, an interview of Franklin himself as well as classroom observations. She completed Middle Stage D afterwards (see Figure 2.7). In light of her existing case conceptualization, Colleen chose to conduct a focused, but unstructured, student interview (one largely idiographic). Even so, she first considered whether there were signs of diagnosable psychopathology (she briefly operated nomothetically). During a wide-ranging discussion, Franklin seemed free of pervasive anxiety, noteworthy depression, obsessions or compulsions, poor reality contact, and eating or movement problems (i.e., tics). He denied a history of trauma. Nonetheless, Colleen observed a youngster who seemed soft-spoken, reserved, a bit socially uncomfortable, and clearly slow to warm up. More important, Franklin volunteered that he is indeed “shy,” and that he is quite distressed by the many changes that make up his seventh-grade experience, including moving from class to class. What’s more, he revealed that two of his teachers (both men) make him particularly uncomfortable, as they reportedly single out students for humiliation. Temperamentally sensitive Franklin understandably feared his own humiliation might be on the horizon. Consequently, it’s no surprise to Colleen when Franklin shared that he sometimes purposely avoids class. Interview findings are summarized in new bullet points under the updated hypothesis entitled “recent onset stress + avoidance + potential embarrassment + interaction issues.”
Next, striving to avoid confirmation bias, Colleen devised her own case-specific classroom observation strategy (still part of Middle Stage D). She hoped that her strategy would let her collect semi-objective indicators of classroom distress (the plan involved her completing a simple, repeatable rating scale she put together for just this purpose). Specifically, Colleen checked Franklin’s appearance of distress during two observations in classes taught by the male teachers that Franklin seemed troubled by. She did the same with two other teachers. This method offers the prospect of disconfirming her strongest hypothesis. Once she analyzed her ratings across days and across classroom settings, however, her observations corresponded to (i.e., failed to refute) her prior conceptualization. Franklin was indeed rated as more distressed on every occasion in which he was observed in the classrooms of either of the two purportedly-hostile male teachers.
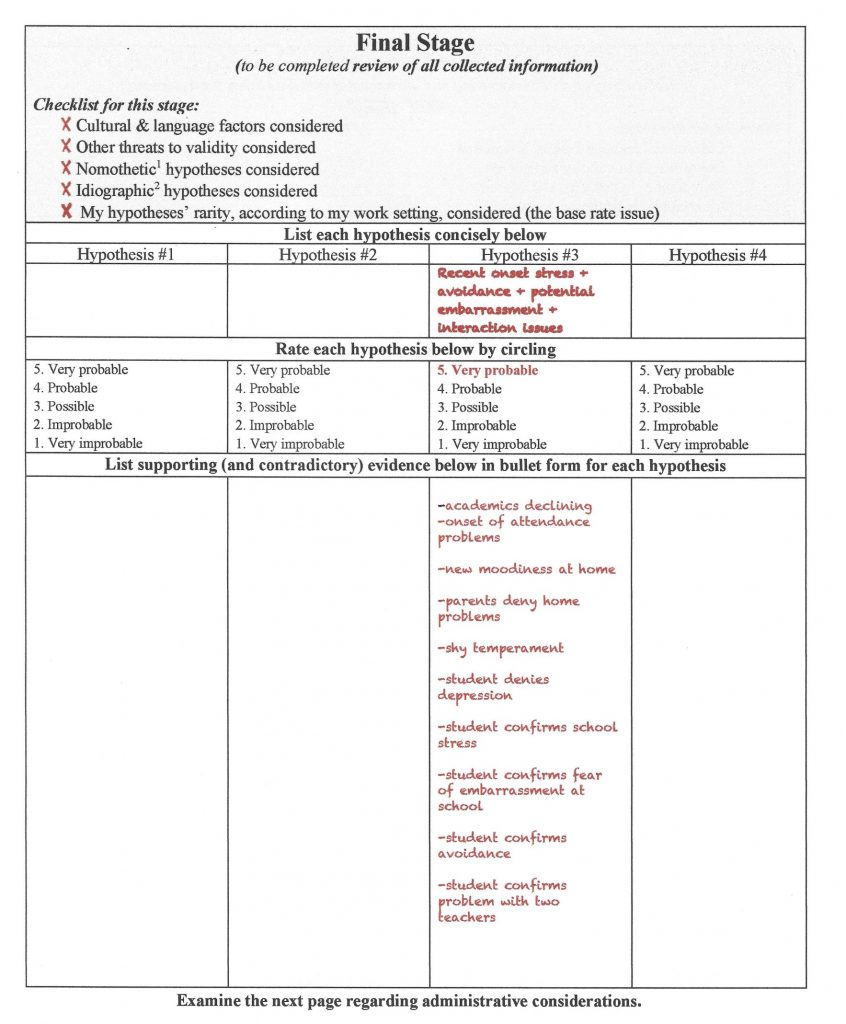
In light of all of these facts, many school psychologists would now rate the “recent onset stress + avoidance + potential embarrassment + interaction issues” hypothesis as “very probable” (i.e., meriting a 5 rating on the HR Worksheet). Some practitioners, however, would continue to entertain, and seek leads, regarding other possibilities. In fact, Colleen left the Middle Stage E page blank (see Figure 2.8) because she used no narrowband rating scales (you will learn about these important assessment tools in Chapter 6). School psychologists assigning a value of 5 to any hypothesis might then stop collecting assessment information. In Franklin’s case, such school psychologists would finalize their analysis by rating the “recent onset stress + avoidance + potential embarrassment + interaction issues” hypothesis as very probable (a rating of 5 “very probable”), as Colleen did. But for other school psychologists who might remain unconvinced, ratings of 3 (“possible”) or 4 (“probable”) might be assigned to “recent onset stress + avoidance + potential embarrassment + interaction issues” hypothesis. These school psychologists, in turn, might seek more information. Their supplemental endeavors might involve conducting additional classroom observations, using broadband rating scales, or even using narrowband (Middle Stage E) scales. In this illustration, however, Colleen simply moved down to the Final Stage after skipping Middle Stage E. Here she wrote all of the supporting evidence under her final explanation.
You can see that at the Final Stage Colleen has consolidated all of her information (see Figure 2.9). This includes all evidence listed in bullet form. Like before, Colleen reconfirms that she has not neglected cultural facts, threats to validity, or base rate as she thinks about Franklin from both nomothetic and idiographic perspectives. She completes the “Checklist for this stage” once again. As you might suspected, report preparation and oral presentations are easily supported by such a listing of facts. All of the important elements of case conceptualization are available in synthesized form in a single spot.
Perhaps you noticed something potentially unusual about Franklin’s case—there were no tests or rating scales used. This is important because sometimes school psychologists equate the social-emotional assessment process to administering, interpreting, and reporting psychometric test results in a largely nomothetic (norm-referenced) manner. If the folly of this approach is not already self-evident, you will soon see the logical problems inherent in trusting test scores alone to make assessment conclusions. Franklin’s case also conveys how understanding him unfolds one stage at a time. What is left at the end of the HR process is a critical distillation of the available information that represents the best-bet inference for answering the referral question.
There is something else worth noting in Franklin’s case. The Colleen was not concerned principally with administrative issues. In other words, Colleen never envisioned her role as mostly about special education gatekeeping. Moreover, as the case unfolded there was little evidence that Franklin suffered a condition that merited consideration for a special education designation. Nonetheless, after hypothesis development and confirmation was concluded (i.e., the HR Worksheet Final Stage was reached), Colleen was still obligated to consider whether administrative labels ought to be considered. In other words, might she need to consider criteria for one or more condition associated with school services (e.g., the categories of Emotional Disability [ED] or Other Health Impairment [OHI])? You see on the next page of the HR Worksheet (Figure 2.10) a prompt to consider administrative tasks. Often, depending on practice circumstances, eligibility for special education services and corresponding use of administrative labels would be addressed as a final act of conducting a student evaluation. When this is the case, use of a eligibility-related checklist is advised. You will see more later in this chapter about checklists and you will see far more about special education eligibility in later chapters. Colleen confirmed that in her school district psychologists indeed address OHI, Autism, ED, and Section 504 eligibility. Critically, however, Franklin’s case failed to warrant use of a special checklist regarding eligibility for any of these possibilities. Note how Colleen checked off her obligations on the next-to-last page of Franklin’s HR Worksheet (in a section entitled Administrative Considerations).
The final page of the HR Worksheet is simply a location for placing notes (see Figure 2.11). Colleen jotted down a few facts that she might want to refer back to later as she works with administrators, teachers, parents and Franklin himself.
You are encouraged to think of Franklin’s case as simply an introduction to use of the HR Worksheet. You will see the Worksheet again in later chapters. Your Skills Workbook also will provide a vehicle for practice.
To summarized, the HR Worksheet requires use of the Reflective System. There is no way to complete it without slowing down and thinking. Inferences without evidence are culled. No hypothesis can be adopted with just a single piece of evidence. It might be an overreach to call this method “smart practice.” But it is at least “reflective practice” and “thorough practice.” We continue the search for tools to promote smart practice below.
Probability Nomogram
The HR approach may seem unfamiliar, but its use is hardly complicated. In reality, it involves just writing down your ideas so that they can be tracked as you judge how much each is worth. Relatedly, the HR Form prompts you to think about things that you sometimes neglect (e.g., linguistic and cultural considerations), but these serve as mere reminders. Nothing new is demanded. The HR approach is flexible. It’s easily adapted to various types of social-emotional assessments.
That said, there is a more sophisticated approach that is worth learning. Right now, this approach is not in regular school-based use, so your supervisor may not know about it. Similarly, your professor might skip this section or make its reading optional. But this approach, the Bayesian approach, has grown wildly popular. It has become a staple of modern analysis for fields as diverse as health care, finance, national security, and governmental policy (Pinker, 2018). It is also interesting that popular books on Bayesian applications now abound, and their titles are instructive: Bayesian Statistics the Fun Way: Understanding Statistics and Probability with Star Wars, LEGO, and Rubber Ducks (Kurt, 2019); Bayes Theorem: A Visual Guide for Beginners (Morris, 2016). Something is resonating among modern thinkers. Fortunately, we only need a small fragment of this technology and its logical basis for psychological decisions. Probability nomograms (based on Bayes’ rule) prove well suited to categorical decisions–judging the presence or absence of a particular disorder. Perhaps even more important, probability nomograms can be an eye-opener about the limitations of trusting test scores in isolation. The probability nomogram mandates use of simple arithmetic calculations coupled with elementary logic. The payoff is that it can help you come up with numbers (i.e., quantitative probability estimates).
Let’s go back to the example of Tom W., the shy college student mentioned earlier in this chapter. Although he is fictitious, Tom W. has achieved fame. He is mentioned every single day in workshops on probability. He can also be found in numerous YouTube lectures concerning errors of decision making. What’s more, Tom W. has become familiar to the more than two million readers of Kahneman’s book (2011) where he, and his competing majors, was first introduced to the general public. Tom W. reveals what happens if automatic thinking and intuition dominate judgments. For our sake, this classic case can be simplified to just this question: “Is Tom a PhD math student or someone enrolled in the business college?” This is just what Julia Galef, at the Center for Applied Rationality, did her YouTube video on Bayesian thinking: https://www.youtube.com/watch?v=BrK7X_XlGB8&t=255s.
As you have already heard, the question of Tom W.’s major often provokes the representativeness heuristic and its automatic, unconscious reliance on stereotypes. This heuristic prompts us to intuit that Tom W. (fulfilling the shy PhD math candidate stereotype) must indeed be an advanced math student. If, however, reflective thinking is brought into play, things start to look different. The Reflective System (Kahneman’s System 2) likes facts and it likes analysis. Via the Reflective System, pencil can be put to paper to make sense of shy, socially awkward Tom W.’s likely major. Just two sets of estimates are needed:
- the percent of the university’s student body enrolled in business and the percent of the study body in PhD math programs
- the rate of “shyness” among business students and the rate of “shyness” among PhD math students
Combined, these two pieces of information reflect a Bayesian approach. Numerical consolidation of information related to prevalence (i.e., the frequency of various majors on campus) and personality (the relationship of shyness to one’s major) would tame the representativeness heuristic. This is because the Reflective System (deliberate, conscious analysis) is employed once you start to do calculations.
Simply put, then, Bayesian statistics concerns how we change probability judgments in the presence of new information. If applied to Tom W.’s case, Bayesian-type calculations suggest that Tom W. would turn out to be four times more likely to be a business student. This can be computed if you assume that there are 20 times as many business students on campus as math PhD candidates and that business students have a shyness rate of 10% whereas PhD math students have a shyness rate of 50%. (By the way, the prevalence of campus majors [base rates] and the shyness rate among those of various majors was simply made up for this illustration, but real numbers could be collected for any particular college campus.)
Base Rates (Local Prevalence Rates)
Tom W.’s case raises an important fact. Most people, lay and professional, given both prevalence rates and personality information ignore prevalence (Kahneman, 2011). On the other hand, prevalence rates presented alone tend to lead to correct probability inferences (Kahneman, 2011). In other words, the challenge of inferring Tom W.’s major accompanied by no personality descriptions generally leads people to say something like, “Tom is much more likely to be a business major because there are so many more of them on campus than there are PhD math students.” Once diagnostic information (Tom W.’s shyness) becomes available, however, it proves so salient that the Automatic System grabs it to quickly call up stereotypes.
As we begin to think about practice implications, a couple terms need to be clarified. “Population prevalence rate” concerns the percentage of a population (such as the entire population of U.S.) that has a particular condition. This might be, for example, the percentage of U.S. citizens who have tuberculosis. In contrast, “local prevalence rate” concerns the percent of individuals at a particular location (e.g., the office of a pulmonary disease specialist in Indianapolis) who have tuberculosis. For practitioners in the midst of an assessment, population prevalence rates are interesting but only somewhat helpful. Knowing the rarity of autism in the general population is one thing. Knowing the rarity of autism among students seen for assessment at one of your elementary school sites is quite another thing. The latter is “local prevalence rate.” It is also known more popularly as “base rate.” Critically, base rate for each disorder varies from setting to setting. Base rate is very, very important in making accurate categorical judgments. But practitioners routinely disregard it. Like in the Tom W. case, we psychologists love to lean on salient behavioral features (or test scores) for our judgments.
Now let’s see what psychologists do with Bayes’s rule. One of the chief proponents of using Bayesian statistics diagnostically is Eric Youngstrom at the University of North Carolina-Chapel Hill. His research group focuses primarily on pediatric bipolar disorder (PBD), a condition generally of little interest to school psychologists. But Youngstrom’s work can help us understand Bayesian applications and probability nomograms. It’s no surprise that Youngstrom (2007) found differing base rate of PBD from practice venue to practice venue. For example, at youth incarceration facilities the base rate of PBD was about 2%; in community mental health centers 6% to 8%; in acute care psychiatric inpatient settings 21% to 40%. Thus, if someone blindly guessed that a locked-up youth had PBD, she would be correct roughly 2% of the time. But if the same blind guess (i.e., this individual has PBD) were made regarding a youth in a psychiatric hospital setting, she would be correct as high as 40% of the time. Clearly, diagnosticians are not entirely naïve before collecting diagnostic information (e.g., test scores) if they think about base rate. More precisely, base rate numbers can inform diagnosticians about a “prior probability” for a particular condition at the particular venue. Via a Bayesian procedure, his prior (pre-diagnostic data) probability can be married to various diagnostic information from test scores, interviews, and direct observations to produce updated probabilities.
None of these advantages are possible, however, if psychologists simply disregard the idea of base rates. To ignore local prevalence rates in favor of diagnostic information standing alone (i.e., test scores) is known as “base rate neglect,” the phenomenon you read about earlier in the chapter. When school psychologists are make judgments about low base rate disorders (e.g., schizophrenia, autism), base rate neglect can lead to false positives (Wilcox & Schroeder, 2015). To the school psychologist, it seems like schizophrenia or autism must be present because a test score says so. But (much like in the case of Tom W.) this may be a faulty conclusion prompted by the representativeness heuristic. An antidote is a (Bayesian) probability nomogram.
Thomas Bayes was an 18th century English minister who was trained in logic. He devised a rule for estimating probability as new sources of information were collected. Bayes did not think his work was especially important and in fact it was largely passed over during his lifetime, only to be resurrected in the 1950s. Calculations can take a bit of time, but there are websites with tutorials that specify each variable in Bayes’s equation and how to compute probability https://www.mathsisfun.com/data/bayes-theorem.html.
Happily for us, a simple tool–a probability nomogram–precludes the need to calculate . The probability nomogram is a simple, pencil-and-paper methodology that is employed throughout the current book, as well as in the Skills Workbook. Figure 2.12 contains two lines drawn in an illustrative nomogram. Take a peek at it now. We’ll return to it later. At first appearance, this likely seems complicated. Do not panic. There will be many chances to practice this technique later in the book.
To complete a probability nomogram, two pieces of information are needed. One is base rate at particular setting (in the form of a percentage). The other a measure of how well a test (or other assessment tool) distinguishes those with and without a particular disorder. This is in the form of a ratio. Base rate is used to establish a prior (pretest) probability. The ratio raises for lower the initial probability. But where does the ratio come from? What is its nature? The ratios can be found in applied research articles or test manuals. Ratios concern evidence of proper classification of individuals with a disorder (according to a gold standard) coupled with how well a test works to correctly classify those without a disorder (according to a gold standard). In other words, one relies on sensitivity and specificity values (topic covered in Chapter 1).
For each diagnostic tool (e.g., behavioral rating scale), one set of applied statistics is needed in case you have a positive result (e.g., a test score above a cut-point) for the student with whom you are working. Obviously, another is needed when you encounter a negative result (e.g., a test score below a cut-point) for your student. The formal name for the applied statistic is Diagnostic Likelihood Ratio (DLR). DLRs turn out to quite informative. A DLRpositive (indicating a score above the cut-line) would quantify how much more likely an individual is to have a disorder if you found a positive test result for her. In other words, how much of a bump is applied to the existing probability because of this positive score. In contrast, a DLRnegative (indicating a score below a cut-line) would quantify how much less likely an individual is to have a disorder if you found a negative test result for him. In other words, how much of a dip is applied to the existing probability because of this negative score. This is a lot to digest. And realistically you may or may not ever need to calculate DLRs for yourself (i.e., researchers have done the calculations for you). You might look at Appendix A for more details. It shows DLRs for data you already read about in Chapter 1, Canivez and Gaboury’s investigation of diagnostic information from CAS and gold standard establishment of ADHD.
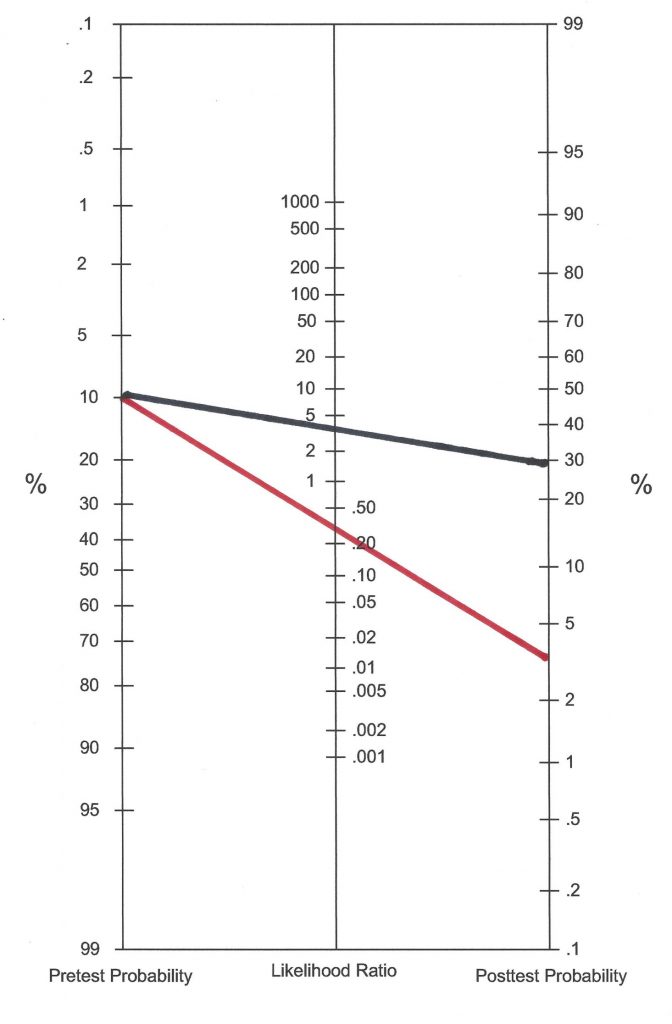
Let’s get practical. Here are the steps (also see, Jenkins, Youngstrom, Washburn & Youngstrom, 2011). We’ll use the DLRpositive of 3.2 and DLRnegative of .28 that Canivez and Gaboury found with the CAS simply for illustrative purposes. Examining Figure 2.12 as you read will make things more concrete. The black line assumes this student had a positive score (i.e., one above the cut-point). A red line assumes a negative score (i.e., one below the cut point).
- Estimate a pretest probability of ADHD (i.e., the local base rate of ADHD among those referred for assessment at this site). Enter this value at the appropriate spot in the left vertical line. For illustrative purposes, an ADHD base rate of .10 was selected.
- Use either a DLRpositive value (if a positive test score was found for this student) or DLRnegative value (if a negative test score was found for this student). Enter this value at the appropriate elevation on the middle vertical line. The first line in this nomogram (the black one) indicates a positive CAS score (with a DLRpositive of 3.2); the second line in this nomogram (the red one) indicates a negative CAS score (with a DLRnegative of .26). [These DLR values were pre-calculated using a standard formula you already heard about. Appendix A can walk interested readers through the steps].
- Connect the dots and draw a line extending to the right vertical line (this is the posttest probability). A positive CAS score (black line) produces a posttest probability of this student having ADHD of approximately .30; a negative CAS score (red line) produces a posttest probability of .03.
- If additional diagnostic information were available, then another nomogram could be completed. To do so, you would place the posterior probability from step #3 in the left vertical line of a new nomogram.
- Find a new DLR matching the new risk factors and enter this value in the middle vertical line of the new nomogram.
- Connect the dots anew and draw a line reaching the right vertical line (this is the updated posttest probability).
- These steps can be repeated as many times as needed.
What might this example teach us? It is clear from Figure 2.12 that modest DLRpositive values alone are unlikely to do much to confirm diagnoses in setting with a low base rate (even though the posttest probability gets a big relative boost). As shown again in Chapter 5, behavioral rating scale scores (e.g.., Conners Comprehensive Behavior Rating Scale) alone are often insufficient to create a high posttest probability. For this reason, it helps to create a second, third, and fourth nomogram if possible. In fairness regarding our example, the CAS (and now its successor, the CAS-2) were designed for various diagnostic and planning tasks, and ADHD diagnosis was never principal among them.
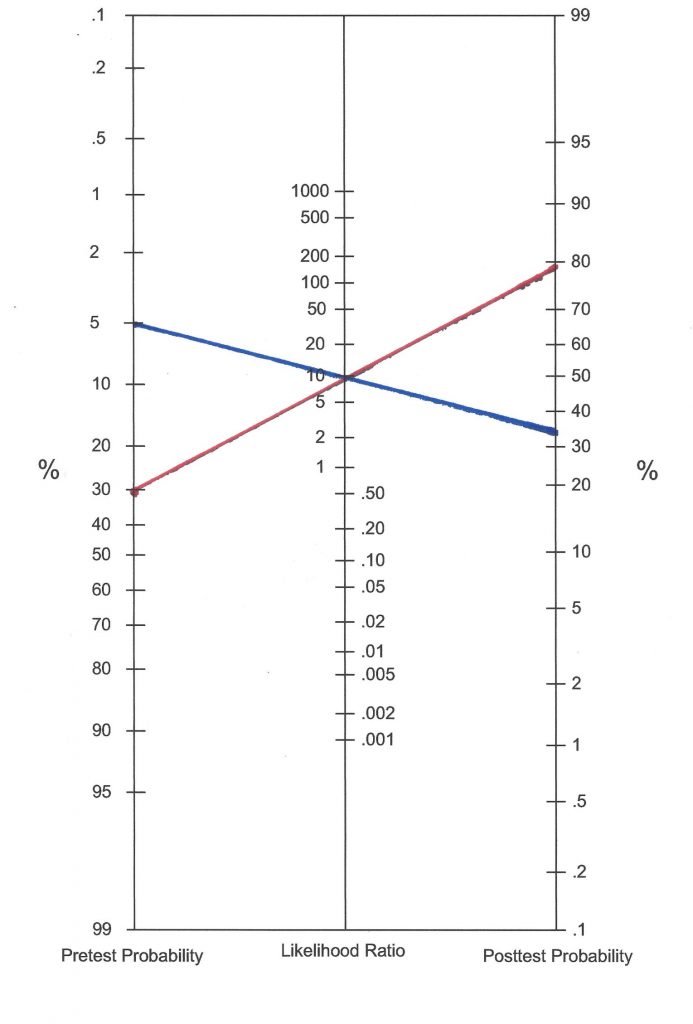
Let’s take a closer look at the impact of base rate via another example. We’ll stick with ADHD, but consider an ADHD-specific tool (ADHD-5 Rating Scale; DuPaul, Power, Anastopoulos & Reid, 2016). In advance, a good cut-point for teacher and parents rates was selected and DLRs were calculated (don’t worry currently about how this was done). The DLRpositive was earlier calculated to be 9.6. We’ll just focus on what would happen with a positive test result. Now look at Figure 2.13. First consider a setting with a low ADHD base rate (setting A, the blue line). Here, the base rate value is pegged at .05 (we do not actually know the base rate value in this illustration, so we can use .05 because it is close to the population prevalence rate). This base rate value is entered into the first nomogram in the far-left column in blue ink. Still working with setting A’s nomogram, the middle column concerns the DLRpositive, which is entered as 9.6. A line (in blue) is simply drawn to connect the two dots. A posttest probability, considering both base rate and diagnostic information, is approximately a bit above 30%. This means that in this setting, with its base rate and with this one piece of diagnostic information, that the best estimate for this individual is an approximately 30% chance of having ADHD.
Now look at the red line in Figure 2.13. It concerns a venue with a much higher ADHD base rate (setting B). In this psychologist’s particular practice setting the base rate for ADHD is known to be (or is estimated to be) .30. This might be a clinic that where many clients are ultimately confirmed to have ADHD. Working through the setting B (red) line in the same manner, one sees that the line connecting the pretest probability and diagnostic information (the DLRpositive of 9.6) produces a much higher posttest probability. Using these two pieces of information alone, the student assessed in setting B has a posttest probability of approximately 75%. It’s the same lesson as with Figure 2.12; base rate matter.
With the ability to tame heuristics (e.g., availability, representativeness) and avoid biases (e.g., confirmation) and because of their insistence on data and logic, nomograms might be considered a tool indicative of “smart practice.”
A practical point needs mention while the topic includes ratios (i.e., nomogram’s middle column). Ratios are not confined to those coming from test scores You will see in later chapters that family history, comorbidity, and results from diagnostic interviews can be used to create ratios comparable to DLRs. Take family history. All that is needed is the likelihood (the percentage) of a particular condition in the presence of a risk compared to the likelihood in a control group or in a reference group (i.e., those without the risk; Andrade, 2015). For example, relative risk for a schizophrenia diagnosis can be calculated based on a positive family history of schizophrenia. About 1% of the population has schizophrenia. When a sibling has schizophrenia, however, the rate jumps to 8%. The ratio of 8 over 1 (8.0) can be entered into the middle column of a nomogram, just like DLRs from test scores.
Another point while we are here. DLRs are not useful only in probability nomograms. They also serve as effect size indicators (just like Cohen’s d and eta squared). As such, they provide a common metric denoting how well a test (or some other diagnostic procedure) succeeds in classifying individuals with a particular condition (see Table 2.2). As you will see in later chapters, some rating scales and psychological tests are quite successful at classifying (they possess moderate or even large DLRs). Surprisingly, some commercial instruments have DLRs indicating only minimal or even no effect. It’s surprising but some published instruments fail to report applied research on classification using their tool. With no sensitivity or specificity values, DLRs are incapable of being calculated.
Table 2.2 Understanding the Range and Effect of DLRs |
|
|
DLRpositive When a diagnostic test is positive (above a cut-point) |
|
|
Size of calculated DLR |
Effect size (serving to increase posttest probability) |
|
<1.0 |
No effect |
|
1.0-2.0 |
Minimal |
|
2.0-5.0 |
Small |
|
5.0-10.0 |
Moderate |
|
>10.0 |
Large |
|
DLRnegative When a diagnostic test is positive (below a cut-point) |
|
|
Size of calculated DLR |
Effect size (serving to decrease posttest probability) |
|
1.0 |
No effect |
|
0.5-0.9 |
Minimal |
|
0.2-0.5 |
Small |
|
0.1-0.2 |
Moderate |
|
<0.1 |
Large |
Population Prevalence Might Help with Base Rate Estimates
In the real world, base rate information simply may not exist. This reality should not, however, stop school psychologists from slowing down their thinking as they contemplate prior probability (i.e., think in a Bayesian manner). Twelve-year-old Natalie recently displayed a noticeable, but irregular, change of behavior and shift in attitude. On some school days, Natalie is reportedly her usual conventionally-attired and emotionally-modulated self. But on other school days she shows up sporting flamboyant (somewhat odd) clothing and she displays an outrageous interaction style. Her psychologist, thus, contemplates three explanations: (1.) occurrence of dissociative identity disorder (DID, sometimes called “multiple personality disorder”); (2.) occurrence of pediatric bipolar disorder (PBD), (3.) adolescent adjustment problems. Across all practice settings, explanation 1 is extremely improbable because DID is extremely rare, explanation 2 is improbable because PBD is rare (but certainly possible, especially is some settings), explanation 3 is more probable in all settings simply because adolescent adjustment problems are common.
The health field known as epidemiology, in part, concerns the population rates of diseases (and other health conditions). Accordingly, agencies like the U. S. Centers for Disease Control and Prevention (CDC) report prevalence rates on everything from inadequate sleep (70% of U.S. citizens fail to get the recommended 8 hours) to fetal alcohol syndrome (.2 to 1.5 per 1,000 live births) to psychiatric disorders among youth: ADHD = 6.8%; behavior or conduct problems = 3.5%; anxiety 3.0%; depression 2.1%; autism spectrum disorder = 1.1% www.cdc.gov/ncbddd/fasd/data.html; www.cdc.gov/childrensmentalhealth/data.html. Similarly, population prevalence rates are reported for ADHD in school psychology journals (elevated symptoms + impairment = 7.3%; DuPaul, Reid, Anastopoulos, & Power, 2013), as are social anxiety disorder (7%) as found in DSM-5. Information about the frequency of conditions in the general population is helpful and informative for researchers and policy makers, as well as for school psychologists.
Taking a page out of the Bayesian playbook, you might consider writing down prevalence information as you consider hypothetical explanations for students’ problems. The sources above (CDC, DSM-5) can help. Appendix A includes additional information on population prevalence. Doing so helps keep diagnostic information (from psychometric tests, from interviews, from observation) in perspective. Again, explicit actions like this help diagnosticians call forward their Reflective System. The Skills Workbook contains examples to help you practice.
Push Back Against Quantification
School psychologists are trained professionals. Over time, often little by little, most grow to feel confident in their own judgments. But confidence is an emotion state. Confidence is not based on logic, nor does it rest on each person’s documented diagnostic accuracy (Kahneman, 2011). Numbers, like those provided by probability nomograms, diminish the role of personal judgment. As Dawes (1979) put it in a classic paper: “no matter how ethically uncomfortable we may feel at ‘reducing people to mere numbers,’ the fact remains that our clients are people who deserve to be treated in the best manner possible. If that means—as it appears at present—that selection, diagnosis, and prognosis should be based on nothing more than the addition of a few numbers representing values on a number of important attributes, so be it. To do otherwise is cheating the people we serve” (p. 581). You will hear more about using numbers over clinical judgment in Chapter 6 when the topic of actuarial inferences appears regarding personality tests.
Checklists-Essential when Criteria Exist
You have seen how the HR approach and probability nomograms can help sharpen your clinical decision-making while limiting bias and taming cognitive distortions. Happily, the HR method can support your practice when there are several emergent possibilities that need to be formulated and weighed. In parallel, use of a probability nomogram can assist you when one or two categorical possibilities are present for which prior research (e.g., found in test manuals) provides you with diagnostic utility statistics. Simple checklist usage is a third way to boost accuracy and limit errors. Checklists represent an alternative to intuition, automatic thinking, and trusting on-the-spot recall (Ely, Graber & Croskerry, 2011). Suited to many venues, checklists are especially relevant to school-based practice. In fact, it can be argued that checklists are essential any time school psychologists need to confirm (or disconfirm) that a set of explicit criteria are satisfied. This often involves entitlement decisions (e.g., special education eligibility).
Consider two school psychologists. Assume that each operates in her own parallel universe with precisely the same set of school circumstances and case information as her alter ego. The case itself concerns a 9-year-old student referred for possible special education eligibility with particularly strong consideration for the prospect of emotional disturbance (ED). This boy disrupts class and challenges his teacher. His grades have fallen for three straight semesters, and he is now considered for retention in third grade. Various attempts to improve his behavior have all failed. This prompted standard information collection: record review, teacher interview, parent interview, student interview, classroom observation, broadband rating scales.
The first school psychologist, Suzanne Lane, offers the following summary to the colleagues of her local school’s child study team. “I know that this student has a problem. I’ve talked with him, observed him and looked over his rating scales. That said, he does not strike me as a true ED student. I’m just not sold. I think some of his behavior, although clearly atypical for a student his age, is just vindictiveness.”
The second school psychologist is named Marie Toussaint. Marie, at the same point in time speaking to the same group of colleagues, says the following. “I interviewed the student, observed him in class and checked his rating scales. It is my opinion that he satisfies all criteria for ED. His behavior (which is inappropriate in his class) is longstanding, it affects educational performance, and it is present to a marked degree. It is clear that he needs special education services because everything we have tried short of those services has failed.”
How might Suzanne and Marie have reached such contradictory conclusions? What processes might they have used to arrive at their conclusions? Which school psychologist might have the more defensible conclusion? Because this section’s title concerns checklists, you might surmise one of these two ladies employed such a technique. It was, of course, Marie. You can see her conclusions depicted in Figure 2.14. But let’s add some detail to Marie’s situation. During her oral reporting, let’s assume that one of her team members challenges her position (i.e., ED eligibility).
- Colleague: “But might not his behavior be volitional?”
- Marie: “It might be, but that is a difficult thing to know for sure.”
- Colleague: “Should we let him have services if what we see is largely maliciousness?”
- Marie: “My professional position is that we should offer him services if he is entitled to them and not offer him services if he is not. His entitlement depends on satisfying all of the criteria for ED. He satisfies all of them.”
It’s pretty obvious that Marie is engaging the Reflective System. As such, she has a good chance of avoiding errors of clinical decision making.
Now consider Suzanne. It appears as though a complex question (i.e., whether or not the student meets objective criteria for ED) has been supplanted by another [simpler] question. Suzanne substitute question might be any of the following:
- “Does the student deserve services?”
- “Is his misbehavior intentional?”
- “Does he remind me of a student with ‘true’ ED?”
It seems likely that Suzanne is engaging in another heuristic described by Kahneman (2011). This is entitled the substitution heuristic. It occurs when a complex problem is present for which effort and reflective analysis is required. Instead of engaging the Reflective System, however, the individual substitutes a simpler question and then trusts the resulting, intuition-laden, Automatic System’s answer. Because the Automatic System is operating, this happens outside of conscious awareness.
Checklists help prevent unfortunate occurrences like this. In fact, checklists are now advocated for many modern tasks to avoid errors of execution. Gawande’s popular press book, The Checklist Manifesto: How to Get Things Right (2009) provides a rationale for their necessity. This springs not from tasks being too hard, but from our shared human tendency to engage in heuristics (such as the substitution heuristic) or to fall victim to carelessness or forgetfulness after tasks become habitual. Commercial airline pilots are expert in the characteristics of their aircraft and they possess vast knowledge about how to operate them safely. Yet every single flight commences with the same thing—a preflight checklist. In parallel, Suzanne likely knows quite well the definition of ED and she could quickly construct a mental list of the criteria to guide her decision about ED. But she does fails do so. Instead, it appears that she has either suffered a memory failure or that she just skipped mandatory elements even if those elements were actually remembered (either way, the Automatic Systems seems in charge). Gawande (2009) cites both of these glitches as common, even among seasoned experts. The same thing seems to occur in schools when special needs students are assessed or treated. For example, empirical research confirms that school psychologists often neglect use of best practices for English Language Learner (ELL) assessments, even when explicit guidelines exist to inform them (Figueroa & Newson, 2006). Up front use of checklists can help. A case in point is the finding that checklist enhance the integrity of school-based behavioral interventions (Plavnick, Fereri & Maupin, 2010). The same is true for as effective implementation of interventions to assist students with autism (Luna & Rapp 2018). Favorably, checklists are now available to guide school psychologists in tasks ranging from conducting equitable gifted evaluations (Worrell & Erwin, 2011) to school reintegration following cancer treatment (Harris, 2009). Relatedly, checklists are available to protect special needs students outside of schools, such as by alerting those in the criminal justice system that a child with intellectual disability might have entered their organization (Close & Walker, 2010). In light of this information, Suzanne and Marie’s contrasting conclusions prove less puzzling. Suzanne appears confident that she knows what to look for without referring back to objective criteria. In some ways, her approach rests on intuition and clinical judgment. In contradistinction, Marie simply follows the rules with a maximum of conscious thought and little reliance on intuition. Marie winds up with a more defensible position because she is closest to an administrative decision in this administratively oriented situation. You see more about ED eligibility determinations, including using checklists to support decision making, in Chapter 10.
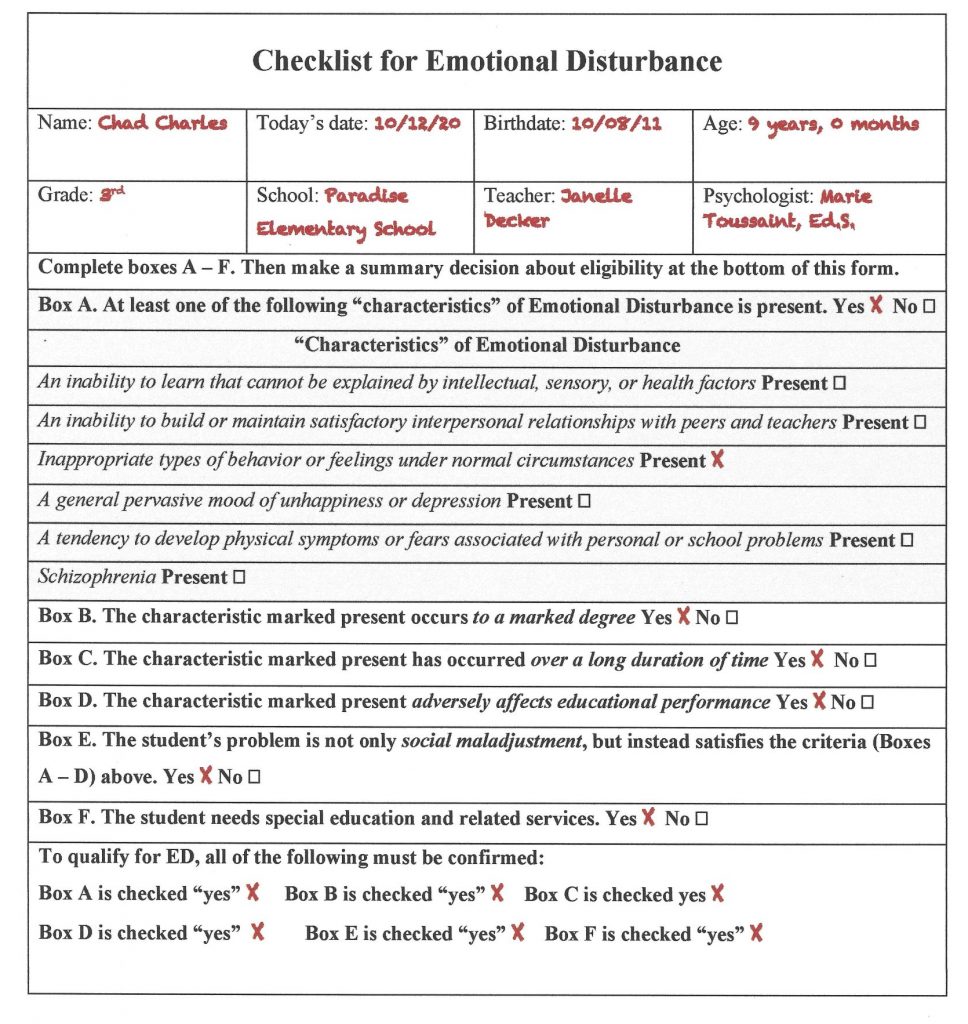
As we finishing the argument for smart (error-limiting) practice, one more heuristic is worth mentioning. It’s the overconfidence heuristic. Simply put, professionals tend to overvalue their own judgment. School psychologists have been warned about this heuristic’s influence on practice (Wilcox & Schroeder, 2015; Watkins, 2009). The overconfidence heuristic is especially likely to rear its head in the absence of a systematic means of reckoning between an individual’s judgments and objective reality (Kahneman, 2011). It’s easy to see how Suzanne might be plagued by overconfidence once she is no longer a novice. Growing familiarity with the assessment process means that the anxiety associated with beginning practice decreases as more and more cases are decided. Sometimes this means that careful compliance with listed criteria that characterized practice early in a career gives way to greater subjectivity and greater confidence. More troubling, there is no check on accuracy. For many practicing school psychologists (and perhaps for Suzanne) ED decisions are seldom or never tested against a gold standard (or an expert peer’s judgment). If one is never found to be wrong, it becomes easy to believe one is always right. What’s more, mounting experience is unlikely to boost accuracy. In fact, a meta-analysis of 74 studies concerning clinical judgment found that more experienced clinicians tended to be only slightly more accurate than their less experienced counterparts (Spengler & Pilipis, 2015). In fact, the effect size was a mere Cohen’s d = .15. Near the end of their lengthy article on scientific thinking as a safeguard against school psychologists’ errors, Lilienfeld, Ammirati and David (2011, p. 30), offer the following concise but cogent admonition, “Be skeptical of clinical wisdom.” To reiterate, school psychologists are urged to employ checklists, not clinical hunches or undifferentiated summary judgments, whenever objective criteria exist. Smart practice requires it.
Summary
Much of our human mental life occurs in a logic-free system that is characterized as “thinking fast,” referred to as the Automatic System here. In contrast, logical problem-solving and nuanced decisions require use of an alternative system that is characterized as “thinking slow,” called the Reflective System here. When the Reflective System receives limited use during assessments, errors of judgments sometimes happen. To limit errors, three techniques aim to slow and organize thinking are presented: the Hypothesize and Revise (HR) approach, the probability nomogram, and checklists. Subsequent chapters will revisit these ideas and help you learn how to apply each in various school situations. Cumulatively, these three approaches can diminish errors and encourage what might be considered “smart practice.”