
Discovering Nutrition Facts
University of Hawai‘i at Mānoa Food Science and Human Nutrition Program
The Labels on Your Food
Understanding the significance of dietary guidelines and how to use DRIs in planning your nutrient intakes can make you better equipped to select the right foods the next time you go to the supermarket.
In the United States, the Nutrition Labeling and Education Act (NLEA) passed in 1990 and came into effect in 1994. In Canada, mandatory labeling came into effect in 2005. As a result, all packaged foods sold in the United States and Canada must have nutrition labels that accurately reflect the contents of the food products. There are several mandated nutrients and some optional ones that manufacturers or packagers include.
In May, 2016 a new Nutrition Facts label for packaged foods, beverages and dietary supplements was announced. This label reflects new scientific information and will make it easier for consumers to make informed food choices. Some of the changes made to the label include:
- Increased type size for “Calories,” “servings per container,” and “Serving size.”
- Bolded type for the number of calories and the “Serving size.”
- Actual amounts of vitamin D, calcium, iron, and potassium (in addition to the Daily Value amounts) are required to be listed. Vitamins A and C are now voluntary.
- Improved footnote to better explain that the Daily Value is based on a 2,000 calories a day diet.
- Changed “Sugars” to “Total Sugars”. Added “Includes” to clarify that “added sugars” is a subcomponent of “total sugars.”
- “Added sugars” in grams and percent Daily Value are required to be listed due to scientific data the impact of added sugars on caloric intake. Added sugars are either added during processing of foods, or are packaged as such, and include items such as: syrups, maltose, and invert sugar.
- “Total Fat,” “Saturated Fat,” “Trans Fat,” “Cholesterol,” “Total Carbohydrates” are still required on the label.
- “Calories from fat” has been removed because the type of fat is important.
- Updated values for sodium, dietary fiber, and vitamin D (which are all required on the label) based on newer scientific research.
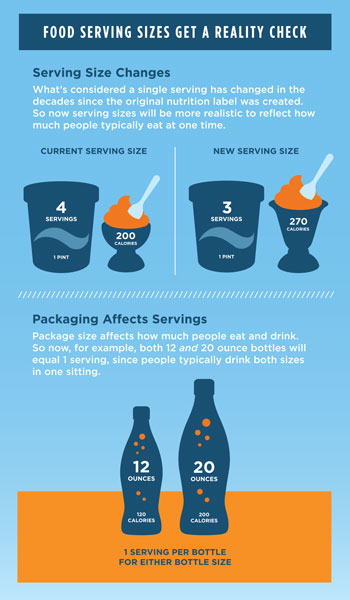
- Updated serving sizes that reflect how much consumers are more likely eating today.
- Some packages with serving sizes between one and two are required to be labelled as one serving since most consumers will likely eat it in one sitting
- Dual columns for certain products that are larger than a single serving but could be consumed in one sitting will indicate “per serving” and “per package” amounts.
- Percent DV of some nutrients were updated due to newly available scientific data.
- The compliance date for manufacturers to adopt the new label was extended to January 1, 2020. Manufacturers with less than $10 million in annual food sales will have until January 1, 2021.
Reading the Label
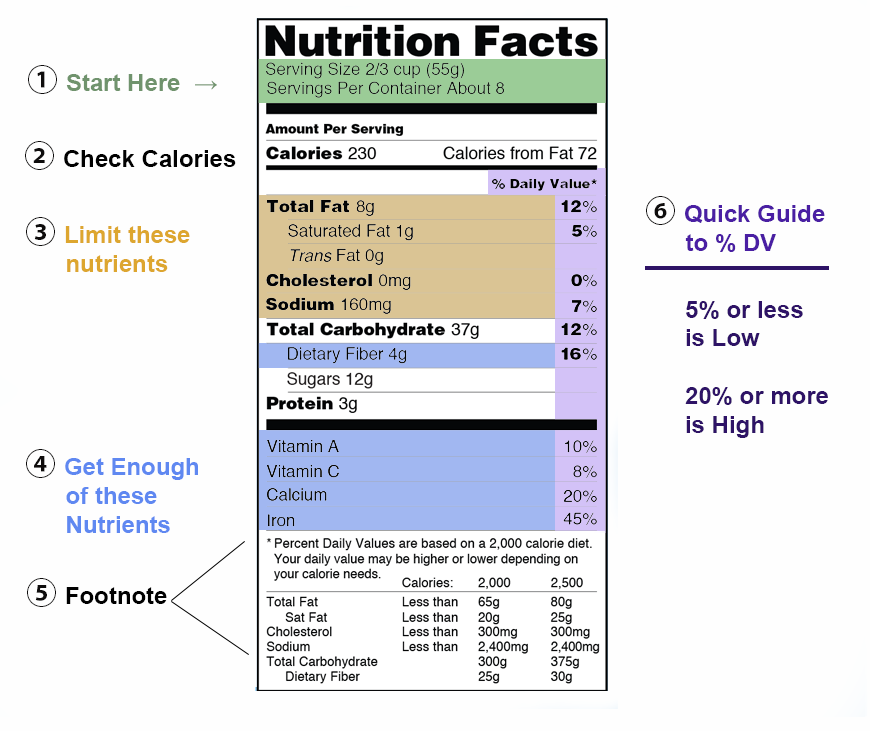
The first part of the Nutrition Facts panel gives you information on the serving size and how many servings are in the container. For example, a label on a box of crackers might tell you that twenty crackers equals one serving and that the whole box contains 10 servings. All other values listed thereafter, from the calories to the dietary fiber, are based on this one serving. On the panel, the serving size is followed by the number of calories and then a list of selected nutrients. You will also see “Percent Daily Value” on the far right-hand side. This helps you determine if the food is a good source of a particular nutrient or not.
The Daily Value (DV) represents the recommended amount of a given nutrient based on the RDA of that nutrient in a 2,000-kilocalorie diet. The DV was updated as part of the new nutrition facts label announced in May 2016. The updated DV applies to packaged food, beverages and dietary supplements that contain ingredients with a DV. The percentage of Daily Value (percent DV) represents the proportion of the total daily recommended amount that you will get from one serving of the food. For example, in the older food label in Figure 12.2 “Reading the Older Nutrition Label,” the percent DV of calcium for one serving of macaroni-and-cheese is 20 percent, which means that one serving of macaroni and cheese provides 20 percent of the daily recommended calcium intake. Since the DV for calcium is 1,300 milligrams, the food producer determined the percent DV for calcium by taking the calcium content in milligrams in each serving, and dividing it by 1,300 milligrams, and then multiplying it by 100 to get it into percentage format. Whether you consume 2,000 calories per day or not you can still use the percent DV as a target reference.
Generally, a percent DV of 5 is considered low and a percent DV of 20 is considered high. This means, as a general rule, for fat, saturated fat, trans fat, cholesterol, or sodium, look for foods with a low percent DV. Alternatively, when concentrating on essential mineral or vitamin intake, look for a high percent DV. To figure out your fat allowance remaining for the day after consuming one serving of macaroni-and-cheese, look at the percent DV for fat, which is 18 percent, and subtract it from 100 percent. To know this amount in grams of fat, read the footnote of the food label to find that the recommended maximum amount of fat grams to consume per day for a 2,000 kilocalories per day diet is 65 grams. Eighteen percent of sixty-five equals about 12 grams. This means that 53 grams of fat are remaining in your fat allowance. Remember, to have a healthy diet the recommendation is to eat less than this amount of fat grams per day, especially if you want to lose weight.
Table 12.2 Updated DVs Based on a Caloric Intake of 2,000 Calories (For Adults and Children Four or More Years of Age)
| Nutrient | Original DV | Updated DV1 |
| Total Fat | 65 g | 78 g |
| Saturated Fat | 20 g | 20 g |
| Cholesterol | 300 mg | 300 mg |
| Sodium | 2400 mg | 2300 mg |
| Potassium | 3500 mg | 4700 mg |
| Total Carbohydrate | 300 g | 275 g |
| Dietary Fiber | 25 g | 28 g |
| Protein | 50 g | 50 g |
| Vitamin A | 5000 IU | 900 µg RAE2 |
| Vitamin C | 60 mg | 90 mg |
| Calcium | 1000 mg | 1300 mg |
| Iron | 18 mg | 18 mg |
| Vitamin D | 400 IU | 20 µg2 |
| Vitamin E | 30 IU | 15 mg alpha-tocopherol2,3 |
| Vitamin K | 80 µg | 120 µg |
| Thiamin | 1.5 mg | 1.2 mg |
| Riboflavin | 1.7 mg | 1.3 mg |
| Niacin | 20 mg | 16 mg NE1 |
| Vitamin B6 | 2 mg | 1.7 mg |
| Folate/Folic Acid | 400 µg | 400 µg DFE2,4 |
| Vitamin B12 | 6 µg | 2.4 µg |
| Biotin | 300 µg | 30 µg |
| Pantothenic Acid | 10 mg | 5 mg |
| Phosphorus | 1000 mg | 1250 mg |
| Iodine | 150 µg | 150 µg |
| Magnesium | 400 mg | 420 mg |
| Zinc | 15 mg | 11 mg |
| Selenium | 70 µg | 55 µg |
| Copper | 2 mg | 0.9 mg |
| Manganese | 2 mg | 2.3 mg |
| Chromium | 120 µg | 35 µg |
| Molybdenum | 75 µg | 45 µg |
| Chloride | 3400 mg | 2300 mg |
|
New Daily Values |
||
| Nutrient | Original DV | Updated DV1 |
| Added sugars | – | 50 g |
| Choline | – | 550 mg |
1 %DV in the nutrition facts label will be reflected on January 1, 2020. Manufacturers with less than $10 million in annual food sales have until January 1, 2021 to comply.
2 Indicates a unit of measure change.
3 The DV decrease for vitamin E applies for natural forms of vitamin E in foods/supplements but not for the synthetic form. Food/supplement containing only the synthetic form of vitamin E, the DV is increased.
4 The DV decrease for folate/folic acid applies only to foods/supplements with folic acid or a mixture of folic acid and naturally occuring folate. The original and updated DV is the same for foods/supplements containing only naturally occurring folate.
Units of Measure Key:
g = grams
mg = milligrams
µg = micrograms
mg NE = milligrams of niacin equivalents
µg DFE = micrograms of dietary folate equivalents
µg RAE = micrograms of retinol activity equivalents
IU = international units
Source: FDA. (2020). Daily Value on the New Nutrition and Supplement Facts Labels. https://www.fda.gov/food/new-nutrition-facts-label/daily-value-new-nutrition-and-supplement-facts-labels
Figure 12.2 Reading the Older Nutrition Label
Adapted from: Image by FDA/Side by Side Comparison of Old and New Nutrition Facts Label
Of course, this is a lot of information to put on a label and some products are too small to accommodate it all. In the case of small packages, such as small containers of yogurt, candy, or fruit bars, permission has been granted to use an abbreviated version of the Nutrition Facts panel. To learn additional details about all of the information contained within the Nutrition Facts panel, see the following website: http://www.fda.gov/Food/ResourcesForYou/Consumers/NFLPM/ucm274593.htm
Original vs. New Format – Infographics to Help Understand the Changes
Figure 12.3 The Original vs. New Nutrition Facts Label

Figure 12.4 The New Nutrition Facts Label
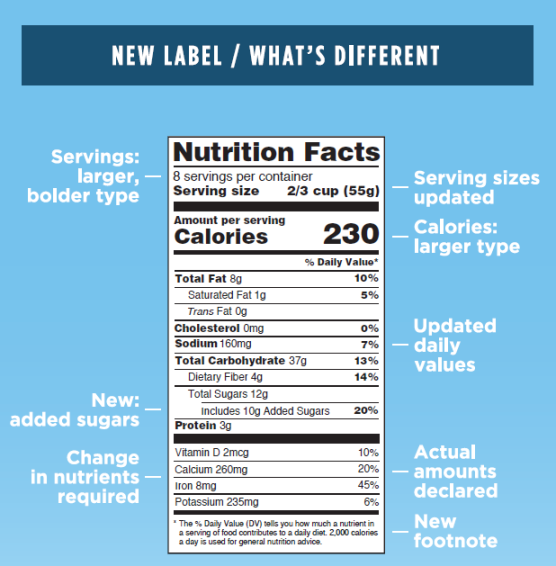
Figure 12.5 Food Serving Sizes
Source: https://www.fda.gov/Food/GuidanceRegulation/GuidanceDocumentsRegulatoryInformation/LabelingNutrition/ucm385663.htm
There are other types of information that are required by law to appear somewhere on the consumer packaging. They include[1]:
- Name and address of the manufacturer, packager, or distributor
- Statement of identity, what the product actually is
- Net contents of the package: weight, volume, measure, or numerical count
- Ingredients, listed in descending order by weight
The Nutrition Facts panel provides a wealth of information about the nutritional content of the product. The information also allows shoppers to compare products. Because the serving sizes are included on the label, you can see how much of each nutrient is in each serving to make the comparisons. Knowing how to read the label is important because of the way some foods are presented. For example, a bag of peanuts at the grocery store may seem like a healthy snack to eat on the way to class. But have a look at that label. Does it contain one serving, or multiple servings? Unless you are buying the individual serving packages, chances are the bag you picked up is at least eight servings, if not more.
According to the 2010 health and diet survey released by the FDA, 54 percent of first-time buyers of a product will check the food label and will use this information to evaluate fat, calorie, vitamin, and sodium content[2]. The survey also notes that more Americans are using food labels and are showing an increased awareness of the connection between diet and health. Having reliable food labels is a top priority of the FDA, which has a new initiative to prepare guidelines for the food industry to construct “front of package” labeling that will make it even easier for Americans to choose healthy foods. Stay tuned for the newest on food labeling by visiting the FDA website: https://www.fda.gov/food/nutrition-education-resources-materials/new-nutrition-facts-label
Claims on Labels
In addition to mandating nutrients and ingredients that must appear on food labels, any nutrient content claims must meet certain requirements. For example, a manufacturer cannot claim that a food is fat-free or low-fat if it is not, in reality, fat-free or low-fat. Low-fat indicates that the product has three or fewer grams of fat; low salt indicates there are fewer than 140 milligrams of sodium, and low-cholesterol indicates there are fewer than 20 milligrams of cholesterol and two grams of saturated fat[3]. See Table 12.3 “Common Label Terms Defined” for some examples.
Table 12.3 Common Label Terms Defined
| Term | Explanation |
| Lean | Fewer than a set amount of grams of fat for that particular cut of meat or seafood |
| High, Rich In, or Excellent Source Of | Contains 20% or more of the nutrient’s DV |
| Good source, Contains or Provides | Contains 10 to 19% of the nutrient’s DV |
| Light/lite | Contains ⅓ fewer calories or 50% less fat; if more than half of calories come from fat, then fat content must be reduced by 50% or more |
| Organic1 | Contains 95% certified organic ingredients |
1 The term “Organic” is regulated by the USDA and appears as a USDA Organic Seal in the front of packaged food products, beverages and dietary supplements

AMS, USDA. https://www.ams.usda.gov/about-ams/programs-offices/national-organic-program.
Health Claims
Often we hear news of a particular nutrient or food product that contributes to our health or may prevent disease. A health claim is a statement that links a particular food with a reduced risk of developing disease. Implied health claims include the use of symbols, statements and other forms of communication that suggest a relationship between a food substance and disease reduction. As such, health claims such as “Three grams of soluble fiber from oatmeal daily in combination with a diet low in cholesterol and saturated fat may reduce the risk of heart disease,” must be evaluated by the FDA before it may appear on packaging. Prior to the passage of the NLEA products that made such claims were categorized as drugs and not food. All health claims must be substantiated by scientific evidence in order for it to be approved and put on a food label. To avoid having companies making false claims, laws also regulate how health claims are presented on food packaging. In addition to the claim being backed up by scientific evidence, it may never claim to diagnose, mitigate, cure or treat the disease. For a detailed list of approved health claims, visit: https://www.fda.gov/food/food-labeling-nutrition/authorized-health-claims-meet-significant-scientific-agreement-ssa-standard
Qualified Health Claims
While health claims must be backed up by hard scientific evidence, qualified health claims have supportive evidence, which is not as definitive as with health claims. The evidence may suggest that the food or nutrient is beneficial. Qualified health claims can be made for both dietary supplements and conventional food items. Wording for this type of claim may look like this: “Supportive but not conclusive research shows that consumption of EPA and DHA omega-3 fatty acids may reduce the risk of coronary artery disease. One serving of [name of food] provides [X] grams of EPA and DHA omega-3 fatty acids. [See nutrition information for total fat, saturated fat, and cholesterol content.] Dietary supplements may declare the amount of EPA and DHA per serving in their section for “supplement facts” instead.
Soure: FDA (2013). Guidance for Industry: Food Labeling Guide. http://www.fda.gov/foodlabelingguide
Structure/Function Claims
Some companies claim that certain foods and nutrients have benefits for health even though no scientific evidence exists. In these cases, food labels are permitted to claim that you may benefit from the food because it may boost your immune system, for example. There may not be claims of diagnosis, cures, treatment, or disease prevention, and there must be a disclaimer that the FDA has not evaluated the claim[4].
Allergy Warnings
Food manufacturers are required by the FDA to list on their packages if the product contains any of the eight most common ingredients that cause food allergies. These eight common allergens are as follows: milk, eggs, peanuts, tree nuts, fish, shellfish, soy, and wheat. (More information on these allergens will be discussed in Chapter 18 “Nutritional Issues”.) The FDA does not require warnings that cross contamination may occur during packaging, however most manufacturers include this advisory as a courtesy. For instance, you may notice a label that states, “This product is manufactured in a factory that also processes peanuts.” If you have food allergies, it is best to avoid products that may have been contaminated with the allergen.
When Enough Is Enough
Estimating Portion Size
Have you ever heard the expression, “Your eyes were bigger than your stomach?” This means that you thought you wanted a lot more food than you could actually eat. Amounts of food can be deceiving to the eye, especially if you have nothing to compare them to. It is very easy to heap a pile of mashed potatoes on your plate, particularly if it is a big plate, and not realize that you have just helped yourself to three portions instead of one.
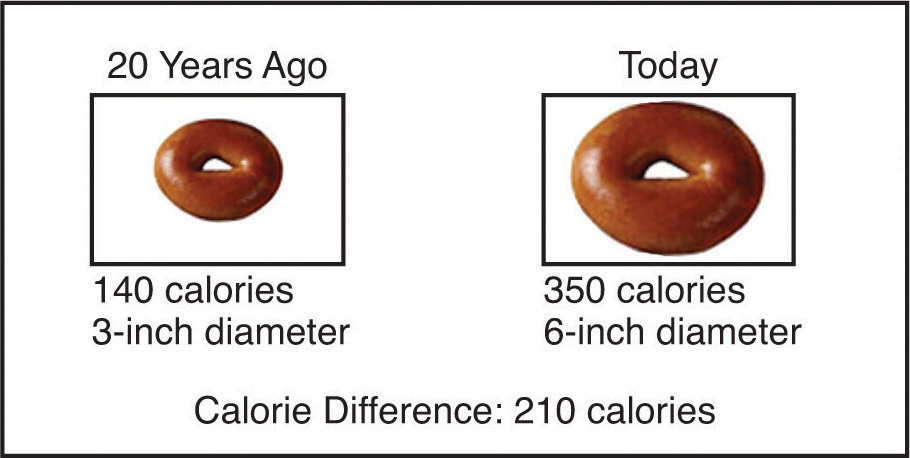
The food industry makes following the 2015 Dietary Guidelines a challenge. In many restaurants and eating establishments, portion sizes have increased, use of solid fats and added sugars (SoFAS) has increased, and consequently the typical meal contains more calories than it used to. In addition, our sedentary lives make it difficult to expend enough calories during normal daily activities. In fact, more than one-third of adults are not physically active at all.
Figure 12.6 A Comparison of Serving Sizes
Source: National Heart, Lung, and Blood Institute Obesity Education Initiative. (2015). Do you know how food portions have changed in 20 years? https://www.nhlbi.nih.gov/health/educational/wecan/portion/documents/PD1.pdf
As food sizes and servings increase it is important to limit the portions of food consumed on a regular basis. Dietitians have come up with some good hints to help people tell how large a portion of food they really have. Some suggest using common items such as a deck of cards while others advocate using your hand as a measuring rule[5].
Table 12.4 Determining Food Portions
| Food Product | Amount | Object Comparison | Hand Comparison |
| Pasta, rice | ½ c. | Tennis ball | Cupped hand |
| Fresh vegetables | 1 c. | Baseball | – |
| Cooked vegetables | ½ c. | – | Cupped hand |
| Meat, poultry, fish | 3 oz. | Deck of cards | Palm of your hand |
| Milk or other beverages | 1 c. | Fist | – |
| Salad dressing | 1 Tbsp. | Thumb | – |
| Oil | 1 tsp. | Thumb tip | – |
Everyday Connections
If you wait many hours between meals, there is a good chance you will overeat. To refrain from overeating try consuming small meals at frequent intervals throughout the day as opposed to two or three large meals. Eat until you are satisfied, not until you feel “stuffed.” Eating slowly and savoring your food allows you to both enjoy what you eat and have time to realize that you are full before you get overfull. Your stomach is about the size of your fist but it expands if you eat excessive amounts of food at one sitting. Eating smaller meals will diminish the size of your appetite over time so you will feel satisfied with smaller amounts of food.
Learning Activities
Technology Note: The second edition of the Human Nutrition Open Educational Resource (OER) textbook features interactive learning activities. These activities are available in the web-based textbook and not available in the downloadable versions (EPUB, Digital PDF, Print_PDF, or Open Document).
Learning activities may be used across various mobile devices, however, for the best user experience it is strongly recommended that users complete these activities using a desktop or laptop computer and in Google Chrome.
- Food Labeling. US Food and Drug Administration. https://www.fda.gov/Food/GuidanceRegulation/GuidanceDocumentsRegulatoryInformation/LabelingNutrition/ucm385663.htm#highlights. Updated November 11, 2017. Accessed November 22, 2017. ↵
- Consumer Research on Labeling, Nutrition, Diet and Health. US Food and Drug Administration. https://www.fda.gov/food/foodscienceresearch/consumerbehaviorresearch/ucm275987.ht. Updated November 17, 2017. ↵
- Nutrient Content Claims. US Food and Drug Administration. https://www.fda.gov/food/ingredientspackaginglabeling/labelingnutrition/ucm2006880.htm. Updated December 9, 2014. Accessed December 10, 2017. ↵
- Claims That Can Be Made for Conventional Foods and Dietary Supplements. US Food and Drug Administration. https://www.fda.gov/food/ingredientspackaginglabeling/labelingnutrition/ucm111447.htm. Updated September 2003. Accessed November 28,2017. ↵
- Controlling Portion Sizes. American Cancer Society. http://www.cancer.org/Healthy/EatHealthyGetActive/TakeControlofYourWeight/controlling-portion-sizes. Updated January 12, 2012. Accessed November 30, 2017. ↵
A substance in food that can provide energy, contribute to body structure, and/or regulate body processes.
A portion of a food label that provides information about the overall nutritional composition of a food and how it fits in the overall diet.
A fat-soluble vitamin that can be made in the body when there is exposure to sunlight and is needed for the absorption of calcium.
Best-known sterol because of its role in heart disease but is also an important molecule in cell membrane structure
A class of nutrients containing carbon, hydrogen, and oxygen atoms; most are commonly known as sugar, starches or dietary fibers.
An essential nutrient the body needs in small amounts that aids in maintaining various body processes like fluid balance.
A type of carbohydrate that is indigestible and cannot be broken down by human digestive enzymes.
(Recommended Dietary Allowance) The levels of intake of essential nutrients that is based off of scientific knowledge, and it judged by the Food and Nutrition Board to be adequate to meet the known nutrient needs for all healthy people.
The standard unit of energy used in nutrition; the amount of heat required to raise temperature of 1 kg water 1℃ .
Organic compounds that are needed in small amounts in the diet to support and regulate the chemical reactions and processes needed for growth, reproduction, and the maintenance of health.
A fundamental unit of energy, equal to 4.1855 joule; 1000 calories equals 1 kcal.
A claim on food labels that is used to describe the level of a nutrient in a food.
A claim found on food labels that describes the relationship between a nutrient or food and a disease of health condition.
Comprised of several types of white blood cells that circulate in the blood and lymph. Jobs are to seek, recruit, attack, and destroy foreign invaders, such as bacteria and viruses.
