9 Reading Velocity from Position Graphs
In the previous chapter we learned velocity is the derivative of position, ![]() . Let’s do one quick problem to make sure we’re good here.
. Let’s do one quick problem to make sure we’re good here.
Exercise 9.1: Calculating Velocities
A particle moves along the trajectory ![]() . Find
. Find ![]() .
.
You should also tell me whether the object is moving in a line or not, and whether it is speeding up or slowing down (you can assume ![]() and
and ![]() are both positive).
are both positive).
In your calculus class, you probably heard that the derivative of a function tells you the slope of that function. Let’s review how that works.
The Derivative of a Function is its Slope
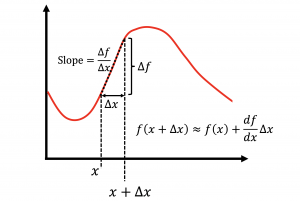
Consider a function ![]() . Recall the derivative is defined as
. Recall the derivative is defined as
![]() .
.
Let’s go through through the connection with slope slowly:
Our final sketch from the video above is critical for our understanding of derivatives and calculus in general. To that end, here’s a prettified version of the sketch that you should have in your head at all times:

Note that if ![]() is increasing as you move to the right, the slope is positive. That is,
is increasing as you move to the right, the slope is positive. That is,
A positive slope is upwards and to the right.
Of course, a negative slope moves down and to the right, implying the function ![]() is decreasing.
is decreasing.
Since velocity is the derivative of position, and a derivative measures the slope of a function, it follows that
velocity is the slope of a curve showing position vs time.
Exercise 9.2: Velocity is the Derivative of Position
The three graphs below record the position of a car as a function of time. Each of the three text bubbles describe the corresponding motions in plain English.
Drag each bubble to the graph it is describing.
Let’s try a few more exercises to make sure we got it.
Exercise 9.3: Reading Position vs. Time Graphs
Drag each bubble to the graph it is describing.
Exercise 9.4:
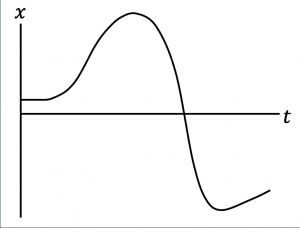
The graph below records the position of a car as a function of time. Use the graph to answer the following questions.

Exercise 9.5:
Key Takeaways
