Appendix A Hypothesis List Concerning Social-Emotional Presentation in School
All of us, especially early in our careers, struggle to come up with explanatory hypotheses. In other words, we look at our accumulating data and only to scratch our head. Perhaps we may envision only a single hypothesis. The HR Worksheet often affords help. As you saw in Chapters 1 and 2, there are often both nomothetic and idiographic possible explanations, and the HR Worksheet prompts you to consider both. This Appendix offers further help. Its two columns fleshes out viable hypotheses for you to consider. The left is a list of common mental health conditions (diagnoses). This is nomothetic. The right provide a host of explanations that spring from situations and perceptions in the students life. This is idiographic. The left column helps you to remember that some conditions have relatively low prior probability (base rate in your setting), whereas others have relatively high prior probability (base rate). Population prevalence rates are listed for some conditions. You are urged to consider local prevalence rates as well as to consider age and gender as a influence the prevalence of various mental health conditions.
Table A.1 Potential Hypotheses (such as in the HR Worksheet) |
|
| Principally nomothetic | Principally idiographic |
|
|
| Note: Do not list OHI, ED, ID, or LD as hypotheses. Although these are important administrative considerations, they offer no explanation of students’ behavior or emotions. | |
| ‡See Chapter 12 for details; ♦See Chapter 11 for details; †See Chapter 2, including local prevalence rates | |
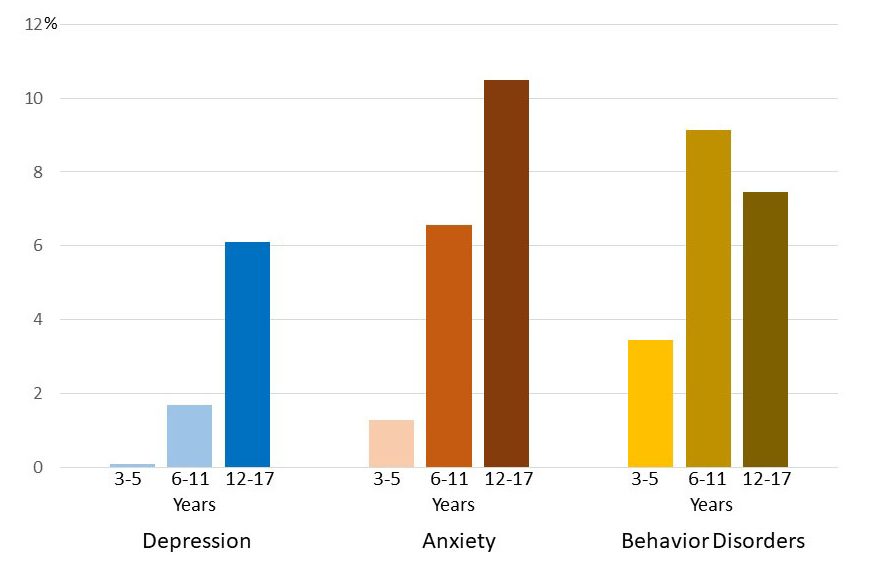
As you saw in Chapter 2, prevalence (especially local prevalence or base rate) can help you judge the prior probability of hypotheses. This is true because some of the nomothetic conditions are common; other rare. Figure A.1, as one example, provide population prevalence for three common conditions. Students’ age obvious matters.