
11 Autism: Special Considerations and Tools
Key takeaways for this chapter…
- The IDEA criteria for autism spectrum disorder and DSM-5’s autism spectrum disorder are similar, but practice setting and local circumstances indicate which is used
- School districts have an obligation to identify students with autism so that they receive special education services or 504 plans
- Although a physician is not required to identify autism, a physician’s involvement sometime in the process may be wise
- When a referral question concerns autism, or when autism emerges as a hypothesis, background information, observation, student interview and rating scales are typically warranted
- Probability nomograms are well-suited for helping school psychologists make determinations about autism’s presence
- When a diagnosis of autism is established, intellectual disability is a distinct risk, mandating consideration of students’ cognitive and adaptive levels
Cases/vignettes in this chapter include…
- The Smithfield family and recurrence risk
- Marie Koffi, assessment of autism
Sally Thompson is a mid-career professional with a history unlike many of her colleagues. Fresh out of high school, Sally pursued a program of studies at a community college in Illinois. This permitted her to become a licensed practical nurse. By her middle 20s, however, Sally was determined to follow a path to higher education. In fact, she subsequently completed a bachelor’s degree in psychology followed a few years later by a Doctor of Psychology (PsyD) in clinical psychology. Her interests, in both nursing and psychology, concerned children. Accordingly, she applied to several externships in pediatric settings followed by a year-long internship at a regional children’s hospital as she finished her final degree. Following training, she worked at an outpatient clinic in Illinois for two years. Clientele in this setting were primarily youngsters with complex and multi-faceted medical problems, including many with developmental disabilities. A family move to New England, followed soon by the arrival of two sons, prompted yet another change; she became a stay-at-home mom. Eventually, Sally enrolled part-time in an Educational Specialist (EdS) degree program in school psychology, which she ultimately completed with her much younger classmates. When her children entered school, so did Sally. She started as a part-time school psychologist, discovered that she loved the setting and her colleagues, and ultimately transitioned to full-time status.
Just before starting her first full-time year in a New England public school, Sally was contacted by the district’s Director of Special Education. She was called to campus for a meeting a week before starting her formal job duties. A student named Marie Koffi was transferring into the district and her special education director, for reasons not entirely understood by Sally, requested a prompt evaluation. Sally learned that the referral question concerned the possibility of autism. Addressing this referral question resonated with Sally because she had previously conducted a number of comparable evaluations in clinic settings. She reasoned her diagnostic skills would readily transfer to her school setting, although she recognized that special education eligibility questions may now be paramount. Before we turn to Sally and her assessment of Marie, there are several broader points to address so as to contextualize this referral and a reasonable method to answer it.
Autism, a Few General Considerations
An Uncommon Intersection of DSM-5 and IDEA
For psychologists working in schools, autism (now more widely referred to as Autism Spectrum Disorder or ASD) is a bit of an oddity. It represents one of the few instances where educational and mental health classification systems meaningfully intersect. School psychologists can find “autism” and “ASD” present in both DSM-5 and IDEA systems. What’s more, the criteria for IDEA’s “autism” and DSM-5’s “ASD” turn out to be nearly the same. As Table 11.1 indicates, both classification systems concern deficits in social communication and socialization coupled with restricted behavior, interests and activities (mandatory in DSM-5, probable in IDEA) together with impact on everyday life (broadly defined in DSM-5, specific to school settings in IDEA). In addition, both systems go on to stipulate early onset as well as a need for diagnosticians to rule out other causes for the child’s atypical presenting behavior. It is interesting that despite these obvious points of agreement, some school psychologists continue to ignore the reality that they and their non-school counterparts are both making essentially the same determination.
Before proceeding, however, a note about terminology. For simplicity’s sake, the term “autism” will be used in most instances in this chapter whenever autism and ASD might both apply. ASD, however, will be used when a specific study or a specific argument using DSM-5 criteria might have been used. Also, please note that the psychiatric definition and terminology associated with autism has shifted over time. When DSM-IV was published in 1994, autism was accompanied by two related conditions. The first of these, Asperger’s disorder, is still sometimes used informally by practitioners (and the term still appears in some relevant research). Asperger’s disorder is defined by restricted, repetitive, and stereotyped patterns of behavior + significant social and communication deficits (but absence of cognitive or language delays). The second term, Pervasive Developmental Disorder-Not Otherwise Specified (PDD-NOS), concerns an array of stereotypic habits and behaviors and/or social and communication problems that although present are insufficient to satisfy the formal criteria for either autism or Asperger’s disorder.
A word of caution is in order. It’s easy to assume that all students with autism (ASD) appear with the same behaviors (i.e., present with the same array of symptoms). This assumption is false. To this point, it is noteworthy that DSM-5’s criterion B is satisfied when any two of four elements (symptom clusters) are documented (see Table 11.1). Consider one student with stereotyped motor movements plus insistence on sameness. Now consider another student lacking these characteristics but who expresses highly restricted and fixated interests coupled with hypersensitivity to sensory input. Both of these students might fully satisfy DSM-5 criterion B, although they may look quite distinct from one another. Similar student-to-student differences often occur regarding intellectual development and language facility. For this reason, DSM-5 prompts diagnosticians when ASD is present to specify first if a co-existing intellectual impairment is present and second if a co-existing language impairment is present. More on this topic appears later in this chapter (and you will see that Sally Thompson addressed these issues in the case of Marie Koffi). Among school psychologists who attend to IDEA criteria rather than those of DSM-5, the logic remains the same. Children with autism and ASD are diverse.
Table 11.1 Overview of DSM-5 Criteria for ASD and Alignment with IDEA’s autism Definition |
|||
|
DSM-5 |
How does IDEA align with DSM–5? |
||
| Social communication and social interaction (this is criterion A) | IDEA is roughly comparable to DSM-5 here
|
||
| Deficits in social-emotional reciprocity (approach, back and forth, sharing, initiative) | All required | “significantly affecting” social interaction | Both required |
| Deficits in nonverbal communication | “significantly affecting” verbal and nonverbal communication | ||
| Deficits in relationships (understand, develop, keep) |
— |
||
|
Restricted behavior, activity and interests (this is criterion B)
|
IDEA is roughly comparable DSM-5 but apparently a bit less stringent here | ||
| Stereotyped movements, use of objects, speech | All least 2 required | Repetitive activities, stereotyped movement | All suggested but none explicitly required |
| Sameness, routines, ritualization | Resistance to change, routines | ||
| Restricted, fixated interests | Unusual responses to sensory experiences | ||
| Hypo/hyper reaction to sensation or unusual sensory interests |
— |
||
|
Other criteria to be satisfied
|
IDEA is roughly comparable DSM-5 but apparently a bit less stringent here | ||
| Early symptom expression | All required | Generally evident before 3 years | Suggested |
| Clinically significant impairment of function | Adverse educational impact not due to emotional disturbance | Required | |
| Not better explained by another disorder
|
— |
||
Autism: A Neurodevelopmental Disorder and a Developmental Disability
Let’s take a step back. Developmental delays, both intellectual disability (ID) and autism, are recognized as “neurodevelopmental” conditions. This simply means that they arise in the brain and first appear during the developmental period (i.e., in childhood, often early childhood). For many other neurodevelopmental conditions (e.g., specific learning disorders), the same assumptions about genesis and onset are made, but speculating about brain dysfunction is not mandatory nor are any medical tests. In other words, genetic testing, brain imaging, or looking for an environmental toxins fails to illuminate the source of or guide the best treatment for a circumscribed spelling problem. In cases of autism and ID (jointly considered to be developmental disability; DD), this may be different. Research reveals that children with DD, but not many other neurodevelopmental conditions, have a documentable risk for a host of underlying physiological anomalies of which many are medically detectable. You will hear more about this later in the chapter.
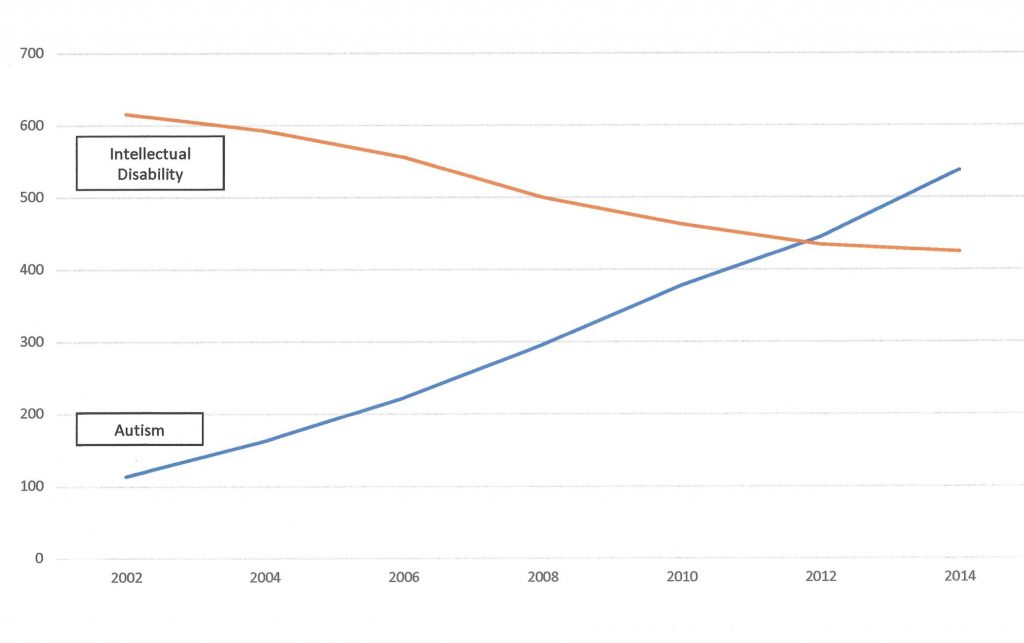
Autism and Intellectual Disability: Changing Prevalence
Newspaper headlines often warn of an autism epidemic. In fact, there are dramatic year-to-year increases reported by authorities. Consider autism prevalence data from the Centers for Disease Control (CDC) https://www.cdc.gov/ncbddd/autism/data.html [retrieved October 14, 2020]. These are summarized over the most recent 16-year period for which numbers are available:
- 2000: 1 in 150 children
- 2002: 1 in 150 children
- 2004: 1 in 125 children
- 2006: 1 in 110 children
- 2008: 1 in 88 children
- 2010: 1 in 68 children
- 2012: 1 in 69 children
- 2014: 1 in 59 children
- 2016: 1 in 54 children
History may offer some prospective. Leo Kanner coined the term “infantile autism” in 1943 to describe a rare, early-onset condition of extreme social withdrawal and interpersonal isolation. The term, however, was not then included in standard nomenclature. What’s more, the term “autism” was not present in the vernacular of rank-and-file Americans in the many years following Kanner’s designation. In fact, it was not until 1980 that autism, together with a set of explicit criteria for its diagnosis, first appeared in a version of DSM (DSM-III). The disorder was still assumed to be rare, although clinicians now reported detecting cases in various sites, including schools.
A dramatic change occurred, and one that is consequential to the apparent rise in prevalence rates, in 1991. Up to that point, no “autism” special education category existed. But when the original federal special education law, PL 94-142 (passed in 1975) was updated in 1991, things changed. IDEA, PL 105-17, then added three new categories, TBI, OHI, and autism. Around this time, autism prevalence rates were low, but already rising. Studies in the U.S. and Europe detected few cases: .5 per 1,000 in France (Fombonne & du Mazaubrun, 1992), 1 per 1,000 in Sweden (Gilberg, Steffenburg & Shaumann, 1991) and fewer than this in the U.S. (Ritvo, et al., 1989). Critically, most of these cases involved concomitant intellectual disability (“mental retardation” at that time). In 1994, DSM-IV expanded the autism definition and made room for the category of Asperger’s disorder (roughly equivalent to high functioning individuals with autism). In 2013, DSM-5 collapsed categories (eliminating the Asperger’s category) but adding more stringent diagnostic criteria. According to DSM-5, some high functioning individuals with communication problems would be diagnosed with “social communication disorder,” but not with autism (see Table 12.1 for DSM-5 and IDEA definitions). Simultaneous with this series of changes, detection methods and public awareness increased. Since 2006, for example, pediatricians have been encouraged to conduct routine screenings of their patients to detect autism. Websites, such as Autism Speaks (founded in 2005), aimed to create awareness. This awareness, in turn, probably lifted prevalence rates. The net effect is that rates have soared, as the CDC numbers listed above attest.
Analysis and reflection are important when interpreting data of any type. The same is true of epidemiological data. The CDC began collecting prevalence data on autism in the year 2000. They did so in a standard manner that assured general comparability of results across years, although not necessarily one that corresponds to many people’s intuitive sense of prevalence. The program, known as the Autism and Developmental Disabilities Monitoring Network, involves record review. Critically, it does not involve face-to-face assessment of any child. Instead, the program examines health and educational records of 8-year-olds in 11 select counties distributed across 11 states. The procedure involves scrutinizing those records for evidence of symptoms and impairments consistent with autism. Trained clinicians follow a rubric for determining whether autism criteria are met in the child’s existing records. That’s where the numbers come from. They constitute a reasonable estimate using a standardized but imperfect set of procedures—nothing more or nothing less.
Prevalence estimates’ methodological blemishes notwithstanding, all of this begs the question. What’s going on? Can these rate changes simply reflect tweaking of diagnostic criteria? Might public awareness drive the increases (prompting autistic-relevant descriptions to populate health and educational records)? Might there be something more consequential and worrisome taking place? Not surprisingly, physical causes have been the topic of intensive research. There are many candidate explanations.
One possible contributory factor is increasing paternal age. Men older than 40 years have been found, for example, to incur an elevated risk of fathering an offspring with various genetic and psychiatric disorders, including autism (Yatsenko & Turek, 2018). New dads in their 40s and 50s are more common today than in years past. Advances in health care might also contribute. There are many more survivors of prematurity and birth complications now than before, and these individuals are also at risk for developmental problems, including autism. This is generally true, although the exact influence of any one perinatal risk factor on the later appearance of autism is unclear (Gardener, Spiegelman & Buka, 2011). Other potential factors that have changed over recent decades, such as the number of mothers with either low body mass indexes or high body mass indexes, may also contribute. Both of these factors have been investigated in large population studies that confirm an association between each factor and giving birth to a child with autism, although the elevated risk is fairly modest (Andersen, Thomsen, Nohr & Lemcke, 2018). One suspected cause of autism has been dismissed, even though there remains considerable public confusion on the topic. This is pediatric vaccinations. Extensive information on this topic appears at the two following CDC links: https://iacc.hhs.gov; https://www.hhs.gov/nvpo/nvac/index.html.
The rate of ID has also changed. As seen in Figure 11.1, cases of intellectual disability (previously called mental retardation) declined as cases of autism soared. What is known about the prospect of ID among those with ASD? Even basic, off-the-shelf resources (e.g., DSM-5) warn diagnosticians that ID is a common co-occurrence. More specifically, a CDC surveillance study (Baio et al., 2018) of eight-year-olds with ASD across 11 states provided evidence of ASD/ID comorbidity. This study found the following specific rates of low IQ (a key criterion for ID determination) among their subjects with ASD:
- IQ < 70 = 31%
- IQ 71-85 = 25%
- IQ >85 = 44%
In light of this distribution of cognitive scores, might it be that one potentially stigmatizing label (autism) has been progressively preferred over another more stigmatizing label (mental retardation/intellectual disability) when both are manifest in the same child? This brings to mind a child neurologist who once provocatively said, “I don’t think there is such a thing as autism, that’s just how many kids with intellectual disability behave.” This cannot reasonably be true, but it does give one pause to reflect. Similarly, the patterns in Figure 11.1 alone cannot explain the changing prevalence of autism. There may be, however, a bit of truth in each.
If the situation isn’t that simple, what is occurring? Some of it may be culturally based on how many students are identified according to IDEA and just who is identified. Interestingly, Travers and colleagues (2004) found that there was a three times greater likelihood of autism identification during just an eight-year period. The same authors found remarkable state by state variability in the rates of autism identification. For example, the rate of European-American students identified in Montana was a scant 0.34% but in Indiana it was three times higher, 1.02%. Furthermore, Black and Hispanic children were identified at relatively low rates, prompting speculation about the role of better access to extra-school pediatric services and stronger parental advocacy by European-American families. For example, Hispanic students in California were identified with autism at a rate of 0.47%, whereas their European-American counterparts were identified at a far more robust rate of 1.15%. Perhaps European-American families, disproportionately, bring their children to clinics for assessments, advocate for their identification, and then come to schools and press for services. If true, these facts would help explain mounting identification rates. https://www.cdc.gov/features/new-autism-data/index.html.
The Etiology of Autism Can Sometimes be Documented Medically
Research reveals that children with DD have a documentable risk for a host of underlying conditions of which many are medically detectable. Critically and uniquely in instances of DD, specifying a cause may help explain the child’s presentation, predict his future course and foretell (to some extent) his needs, or suggest interventions (including prevention of another DD birth for the same parents). For example, one systematic study found that there was a detectable medical cause (e.g., a genetic anomaly, an exposure to a toxin) in 40% of children with DD (Srour, Mazer & Shevell 2006). Perhaps even more important, many of these conditions prove potentially avoidable in subsequent pregnancies or could be addressed in a diagnosed child herself. You will hear more about this later.
Concerning genetic causes of autism, medical diagnosticians may identify a condition that allows them to alert families about specific genetic factors (e.g., single gene conditions). Relatedly, genetic counselors might speak with parents about less specific but still important genetic risks (e.g., recurrence risk based on polygenetic considerations). In fact, NIH now speculates that although taken individually each single gene cause of DD is rare, many single gene disorders start to add up, one child at a time, to result in a great many affected children. Taken together, rare single gene disorders may account for 20 percent or more of all autism cases (National Institute of Neurological Disorders and Stroke, 2022). Table 11.2 list just four of many single gene disorders that may produce autism spectrum symptoms or full syndrome ASD.
Table 11.2 Some Recognized Genetic Causes of Autism
|
||||
|
Fragile X syndrome in boys |
Fragile X syndrome in girls |
Rett syndrome in girls |
Tuberous sclerosis in boys and girls |
|
| Genetics | Mutation on one X chromosome inherited from mother | Mutation on one X chromosome inherited from mother | Mutation on one X chromosome inherited from mother | Mutation on chromosome #9 or #16 |
| Diagnosis
|
Behavioral or developmental features, family history, genetic testing | Behavioral or developmental features, family history, genetic testing | Behavioral or developmental features, genetic testing, rarely family history | Physical features and more rarely developmental or behavioral features |
| Gender-specific effect
|
Boys have only one X chromosome-more severe symptoms predominate | Girls have two X chromosomes-milder symptoms predominate | Girls have two X chromosomes, girls with mutation are affected; most boys with mutation die in utero or in early life | Both boys and girls affected |
| Family history | Boys severely affected and do not reproduce | Female carriers (or mildly affected) able to reproduce | Typically, a spontaneous mutation with no family history | Typically, a spontaneous mutation with no family history |
| Developmental regression | Not typically | Not typically | Yes, often 6-18 months with potential plateaus | Not typically |
| Behavioral features | Autism spectrum | Autism spectrum or anxiety | Autism spectrum | Autism spectrum, hyperactivity |
| Cognitive
features |
Generally delayed | Sometimes delayed with subtle language problems | Progressively delayed | General delay or circumscribed problems |
| Physical
features |
Marked facial dysmorphology | None to subtle facial dysmorphology | Scoliosis, small head | Skin lesions |
Medical Considerations Besides Etiology
A few additional facts warrant consideration when contemplating children with autism. Children with autism are at elevated risk of epilepsy, a condition that is clearly medical in nature. One study, for example, found more than 10% of youth with ASD affected (Gadow, Perlman & Weber, 2017). Perhaps more relevant to practice, the same study found that 36% of children with ASD had lost previously-mastered developmental milestones (i.e., pertaining to communication or socialization). In other words, these were children whose developmental progression gave way to developmental regression. Facts like these make it wise to include a physician somewhere in the loop during or immediately after school teams make an autism identification (Myers & Johnson, 2007). This might be as simple having parents sign a release so that school-based results are sent to a student’s pediatrician. Even better might be a release to enable a phone call from a school psychologist to the child’s primary care physician so as describe what is being found and to seek any pertinent medical additions (Wodrich & Kaplan, 2005).
Autism’s Etiology is not Poor Parenting
A common notion in the mid-20th century was that factors in the child’s social environment triggered autism. This is exemplified by popular writings of the time. You may be able to sense the explanations embedded in three works by the psychoanalyst Bruno Bettelheim simply from their titles: Love is Not Enough (1950), Truants from Life (1954) and The Empty Fortress: Infantile Autism and the Birth of Self (1967). Interpersonally distant, emotionally cold mothers were viewed as particularly instrumental in the genesis of the withdrawn, self-absorbed childhood behavior patterns characteristic of autism.
Critically, however, carefully devised research studies have dismissed the primacy of the social environment. For example, a recent multi-national study of more than two million individuals, including more than 22,000 diagnosed with ASD, found genetic factors to account for 80% of the variance in the appearance of ASD (Bai et al., 2019). Accordingly, environmental influences, both shared and non-shared, exerted dramatically more modest influences. It is worth remembering that in the statistical models used in studies like this that shared environmental influences include factors like family income, parent health, and a family’s access to health care. Non-shared environmental influences include unique events in the child’s pre- and post-natal life, unique interactions with parents and siblings as well as child-specific influences from school and peers (see DeFries, Plomin, Knopik, & Neiderhiser, 2013, for a detailed discussion on behavioral genetics). Perhaps crucial to the erroneous 20th century assertion that family influences (especially those of mothers) induce autism, the researchers concluded that “there was no support for maternal effects” (Bai et al., 2019, p. 1035). Autism is not caused by poor parenting.
In fact, autism’s heritability often works polygenetically (i.e., many, many genes, each exerting a small influence). At the clinical level, this means that autism runs strongly in families, even when there is no discernible genetic “anomaly” found in an individual child diagnosed with autism. Simply having a close biological relative with autism boosts one’s chances of being affected (Hansen et al., 2019). You will see the practical value of facts like this when you consider a child’s family history later in the chapter.
Autism is Rarely “Outgrown”
Although ADHD and autism are distinct conditions, they share this in common—lasting negative effects are the rule rather than the exception. In other words, autism is unlikely to be simply outgrown. To this point, Woolfenden, Sarkozy, Ridley and Williams (2012) conducted a systematic review of 23 prior studies that encompassed 1,466 children with autism. Although there was some variability based on age of diagnosis (e.g., 3-5 years vs. older than 5 years) and whether full syndrome autism or a milder autism variant was present, a general pattern of persistence nonetheless held up. “We found that overall a diagnosis of AD (Autism Disorder) was a reasonably stable diagnosis with highest quality studies estimating 88-89% stability” (Woolfenden et al, 2012, p. 349). Even among high functioning individuals, problems seem apt to persist into adulthood. For example, a UK study of children followed a cohort with ASD plus high nonverbal IQ from age roughly 6 years into their 40s. Outcome variables included the adult presence of ASD symptoms as well as cognitive ability and social functioning during adulthood. The researchers (Howlin, Moss, Savage & Rutter, 2013) discovered that just 17% of the adults experienced either “good” or “very good” outcomes. In contrast, 60% experienced “poor” or “very poor” outcomes.
Psychological Underpinnings of Autism
Science seeks causes—those that are physiological (neurological, genetic), those that are social, as well as those that are psychological. There are a couple candidate psychological failures that might help make sense out of the bewildering array of symptoms seen in autism. Getting a sense of them can sometimes help school psychologists when a potential diagnosis of autism is at issue. These are Theory of Mind and impaired deployment of attention.
Autism May be Associated with Impaired Theory of Mind
Why are children with autism so different from their non-affected counterparts? Simon Baron-Cohen at Cambridge University (1975) proposed that one core deficit of autism is “mindblindness.” That is, individuals with autism lack a typically developing Theory of Mind (ToM). ToM is defined as “the ability to attribute mental states to another person and to infer their underlying intentions, thoughts, emotions and motivation” (Colle, Baron-Cohen, Wheelwright, & van der Lely, 2008, p. 28). ToM has now drawn great focus from researchers as well as from some practitioners; it has been the subject of hundreds of peer-reviewed articles. In brief, it is theorized that without adequate ToM, children with autism struggle to make sense out of the actions of others, setting in motion a host of problems characteristic of autism. They may see the overt behavior of others but not the emotions, motivations, or intentions underlying that behavior. Hints at ToM deficits seem to be evident even early in life when children with autism fail to master early fundamental human social tasks, such as use of joint attention (see Figure 11.3). Interestingly, high-functioning and low-functioning children with ASD may differ regarding ToM. Research suggests that high-functioning children with autism suffer “delays” in ToM development, but that improvements occur over time (Hoogenhout & Malcolm-Smith, 2017). In contrast, lower-functioning children with autism express “deviant development,” characterized by poorer ToM that fails to improve appreciably with age. Laboratory tests used for research purposes, such as the Sally/Anne test, help investigators see in real time the mindblindness that indicates ToM failure, to quantify its expression in autism and control groups, and to track potential changes overtime. You will hear more about ToM when assessment techniques are discussed later in this chapter. By the way, if the name Baron-Cohen seen at the beginning of this paragraph struck you as familiar, you are correct. The academic Simon Baron-Cohen is the first cousin of the entertainer Sacha Baron Cohen (aka Borat, Ali G)!
Autism May be Associated with Impaired (Atypical) Deployment of Attention
Another core psychological deficit of autism may be impaired attentional focus. Mazer (2011) proposed this possibility. According to Mazer, typically developing individuals enjoy a perceptual system that suppresses excessive attentional capture by low-level cues (e.g., bright flashes, fast movements). These things are screened out and render non-problematic. This fact affords most humans a critically important ability to track social interactions without interruptions. For those without autism, the frontal lobes deploy attention to aspects of the environment and effectively shift it to other important aspects, as needed. When autism is present, however, there may be a failure to suppress counterproductive attentional capture.
The hypothesized net effect is unfortunate abnormalities in processing social stimuli. Thus, this line of thinking suggests that an error in a frontal lobes’ control system might underlie some of the social shortcomings found among children with autism. Others have proposed similar processing problems in which there is enhanced perception of local stimulus elements (details) but weakened processing of holistic elements, such as complex patterns (Bellocchi, Henry & Baghdadli, 2017). It is clear that many children with autism express extremely intense focus on selected objects or selected topics. Redeploying attention away from restricted focus can be problematic. This tendency may underlie limited ability to stop one activity so as to move on to another task.
It is widely acknowledged that children with autism experience altered sensory input. Their hyperfocus may help account for “savantism.” Savantism is the occurrence of outstanding (but circumscribed) cognitive or artistic ability in someone with autism or ID or both. Perhaps 10-30% of children with autism express some degree of savantism. Most common expressions are forms of calendar, artistic, memory or musical ability (Dubischar-Krivec, Bolte, Braun, Poustka, Birbaumer & Neumann, 2014).
The following anecdote illustrates an aspect of this notion. A mother brings her 11-year-old son to a school event entitled “Share Your Hobby.” The boy had a truly vast collection of bottle caps arrayed in an extremely detailed manner. In fact, his display far surpassed the relatively modest exhibits of his classmates. When asked, the young man elaborated on his collection, including describing where he acquired each bottle cap, what product each item denoted, and whether each was a twist-off or pop-off variety. This prompted the following conversation:
- First parent: “Your son seems to know a huge amount about his collection.”
- Second parent (mother) responds: “Yes, it is a big part of his life.”
- The first parent adds: “Not very many kids his age can remember so much.”
- Second parent (mother), with exacerbation present in her voice: “It’s amazing how much you can know about a particular topic when you don’t have to waste your time paying attention to things that are important in life.”
The edgy tone of this frustrated parent (the second) aside, her comments reveal that over-focus (common among those with autism) can disrupt normal social functioning. It can also interfere in the classroom when students fail to engage the curriculum because their attention (and, perhaps, preoccupation) so often resides elsewhere.
Big Picture
Most beginning school psychologists benefit from facts like those above before they tackle the practical challenges of considering autism in individual students at school. It’s difficult to search for instances of autism without knowing a bit about its historical roots, causes and psychological underpinnings. Let’s return to our school psychologist, Dr. Sally Thompson, regarding her real-world considerations in the case of Marie Koffi. You will soon see that the uniqueness of autism carries over into practice related concerns for school psychologists like Sally.
Practice Considerations and Sally Thompson’s Situation
Who Should Identify Autism?
Is school psychologist the proper person to identify autism? Often, school psychologists seem to envision a school districts’ identification as a mere educational practice. In contrast, a diagnosis established in a clinic is somehow considered more momentous, consequential, and definitive. This discussion seems to harken back to a dubious assertion encountered earlier in this book–“We in schools identify but we do not diagnose.” Psychologists who have worked in both schools and medical settings can confirm that “we don’t diagnose in schools” represents seeking coverage behind the smallest of fig leaves. After all, in both instances, the child is labeled as “autistic” in the mind of her family and label-dependent autism treatment might well follow regardless of whether the process is entitled “identification” or “diagnosis.” So, does this discussion mean that school-based and clinic-based assessment practices are just the same? Alas, even though IDEA and DSM-5 criteria are roughly equivalent, diagnostic practices outside of schools and those within them are often distinct. This is because a non-school diagnosis is apt to include aspects generally lacking in schools. In contrast, school-based assessments afford the enormously helpful prospect of viewing a student in her natural school environment. School-based teams (and school psychologists like Sally) do indeed routinely classify students with autism. But studies place the rate of school-only-determination of autism at between 38% and 40% (Pettygrove et al., 2013; Yeargin-Allsopp et al, 2003). Just a bit of arithmetic reveals that roughly 60% of identifications thus occur in clinic settings, not schools.
Critically, school-based determinations are often done without a physician team member, even when school psychologists think medical involvement would be wise (McCrimmon & Yule, 2017). Should physicians be involved for autism diagnoses? Consider the NIH’s recommendation for a comprehensive evaluation: “A comprehensive evaluation requires a multidisciplinary team, including a psychologist, neurologist, psychiatrist [emphasis added], speech therapist, and other professionals who diagnose and treat children with ASD. The team members will conduct a thorough neurological assessment and in-depth cognitive and language testing. Because hearing problems can cause behaviors that could be mistaken for ASD, children with delayed speech development should also have their hearing tested.” https://www.ninds.nih.gov/Disorders/Patient-Caregiver-Education/Fact-Sheets/Autism-Spectrum-Disorder-Fact-Sheet. But school psychologists might reasonably ask themselves about the rationale for such a statement. Specific to the upcoming discussion, why should a physician such as a neurologist be involved in something educational? How can that advantage be gained by a school-based team lacking a physician member, which is readily recognized by pediatricians to be how things often occur in schools (Myers & Johnson, 2007).
Assessment Techniques to Identify Autism in Schools
Many of the techniques you have learned about are applicable when a referral question concerns autism or when autism emerges as a working hypothesis. But there are also some unique considerations, and some unique tools, when autism is addressed.
Observation of the Student, Physically and Psychologically
School psychologists can do somethings that physicians might do more consistently and more comfortably if they were involved. One of these concerns a child’s physical presentation. You have already seen in Chapter 8 a rationale for routine inspection for signs of dysmorphology. Dysmorphology is especially important during assessments of autism. Consider, for example, that one of the grossest markers of atypicality, enlarged head circumference, is documented among youth with autism (Lainhart et al., 2006) Beyond head size, Flor, Ballando, Lopez and Shui (2017) encourage physicians to use the Autism Dysmorphology Measure (ADM). The ADM systematically addresses dimensions like hair growth pattern, ears, nose, face size and its structure, mouth and lips, hands, fingers and thumb, and nails. When autism is present, the documentation of dysmorphic features increases the risk of a diagnosable genetic syndrome by 10 times (Miles & Hillman, 2000). When ASD + ID + dysmorphic features were present, then the risk of a genetic condition reached a remarkable 66.7% in this study. In other words, perhaps two-thirds of children with this three-part presentation (dysmorphology, ASD, ID) have an underlying genetic condition ascertainable via standard genetic diagnostic procedures (Battaglia et al., 2013; Jacquemont et al., 2006).
Appraisal of these aspects of physiology, at least at some point in an evolving assessment process, is part of the justification for a position taken by the Child Neurology Society and the American Academy of Neurology ([AAN] see Shevell et al., 2003). Specifically, AAN recommends a consultation with a medical specialist in all suspected cases (e.g., those children who fail a screening [or for our purposes, still have autism as a rule out hypothesis at the end of school-based assessment]). A medical team member might address all potential genetic and etiological considerations, not just the student’s physical appearance. Indeed, one finds suggestions that this point is widely recognized. For example, the following appears in a chapter concerning autism written for psychologists “…medical, language, and other assessment data will need to be integrated to make differential diagnoses” (Frick, Barry & Kamphaus, 2020, p. 378). Similarly, writing expressly about autism assessments (and interventions) in school settings, Wilkinson (2017) lists “medical screening or evaluation” as part of routine autism evaluations.
This type of observation concerns the physical world, not the psychological one. Ideally, a physician might conduct a physical inspection of the child paralleled by a school psychologist’s observations of behavior. Thus, all of the observation techniques you learned about in Chapter 8 fit with autism. This would include observations of behavior and interpersonal style during IQ and achievement testing (anecdotally or using the ASEBA Test Observation Form; TOF) coupled with observations made in the natural school environment. Classrooms and playgrounds constitute ideal venues. School psychologists hoping that their observations generate standardized scores might use the ASEBA Direct Observation Form (DOF). Although both of these ASEBA techniques lack autism scales per se, each includes scores on dimensions like Immature/Withdrawn (found in the DOF) and Language/Thought Problems (found in the TOF). The more familiar BASC-3 Student Observation System (SOS) is another possibility, although standardized scores do not follow from its use. As you may remember from Chapter 8, the BASC-3 SOS prompts professionals toward qualitative (but not quantitative) broad categories like Inappropriate Vocalization, Repetitive Motor Movements, and Self-injurious Behavior, each of which includes several fine-grained behaviors potentially relevant regarding autism. But perhaps a more straightforward observation scheme is better suited to questions about autism. If autism remains as a “very probable,” “probable,” or “possible” hypothesis by the time Middle Stage D is reached in the H-R approach, then turning directly to autism’s exact array of symptoms would seem a logical way to organize observations. To do so, consider opening DSM-5 and turning to the symptom list for ASD. Then simply attend to three symptoms listed. This would include the three listed under criterion A “persistent deficits in social communication and social interaction.” It would also include four symptoms listed under criterion B “restricted, repetitive patterns of behavior, interest, or activities.” Later in this chapter, you will see a specialized procedure that is a hybrid of psychometric assessment and observation, the Autism Diagnostic Observation Schedule-2; ADOS-2). Although observation appears in the title of this procedures, in some ways in strikes many school psychologists are much like a standardized psychometric tool.
Illustration 11.1 Practice Venue Matters Especially Regarding Autism
What you are apt to see in the way of social-emotional problems is determined to a surprising extent by where you practice. Generally true, this assertion is profoundly true regarding autism. If you work in a preschool setting and routinely assess children age 3 to 5 years, autism is likely to be a recurrent consideration. Although the American Academy of Pediatrics (AAP) and the U.S. Centers for Disease Control (CDC) advocate early detection, the process is imperfect. Specifically, the AAP recommends autism screening be accomplished at 18 and 24 months (see AAP and CDC links below). Some children, of course, will fail screening, receive a clinical-based assessment and a few will be identified with autism. This subset of young children likely has one or more physicians involved in their evaluation and ongoing care. Consequently, any required medical tests have probably been conducted. Sometimes preschool-based psychologists help out with paperwork and programming considerations rather than establishing an autism diagnosis per se. But screening is imperfect (false negatives and false positives are inevitable). This places school psychologists front and center for a first-time evaluation of problems with delayed development, strange and/or unmanageable behavior, and social isolation. Autism may lie at the root of such problems. School psychologists and MDTs may be the first professionals to recognize this fact. The bottom line is that preschool-based psychologists need to be especially well versed in autism and its diagnosis.
School psychologists based at elementary schools also need autism-specific facts and assessment skills. Realistically, however, their rate of first-time identification of genuine instances of autism is less than for their preschool-based counterparts. Logic would indicate that, in general, not only will fewer cases appear during the elementary school years, but that novel cases are likely to be more subtle and to represent less severely affected children. For example, co-occurring intellectual disability is less likely, as is extremely challenging behavior. Vigilance and competence, nonetheless, are just as important here as in preschool settings.
Extending this same logic to older children, the conclusions are obvious. During the middle school years, relatively few new autism identifications are likely. Those that arise tend, in general, to have less severe impairments and to possess more off-setting strengths. There are exceptions. These may be due to factors like parents’ preferences about identification, limited intervention services (making earlier identification less consequential), schools’ resistance to labeling, or earlier faulty assessments that missed autism or misclassified it (e.g., a school district in which all school problems requiring special education are merely called SLD). As seen in the case of Marie Koffi (Appendix C), late detection does indeed sometimes fall to the school psychologist stationed at middle schools or high schools.
See the following links: http://pediatrics.aappublications.org/content/136/Supplement_1/S41; https://www.cdc.gov/ncbddd/autism/hcp-screening.html
Background Information and Family History
Family history can provide invaluable diagnostic clues (see Chapters 2 & 4). This fact can be easily overlooked when school psychologists concentrate solely on rating scale scores. To grasp the value of family history, examine Table 11.3. This table depicts results of a very large study (over 37,000 families having at least one child diagnosed with ASD). It concerned the question of elevated risk when a sibling bears an ASD diagnosis (Palmer et al., 2017). Of course, evidence of a positive family history might turn up when you review a parent-completed Developmental History form or talk with a parent. In fact, a striking recurrence risk was documented when a sibling has ASD. For example, this study found that nearly one in six boys who had a sister with ASD will himself have ASD. The rates are lower for girls with an ASD brother, but still elevated over ASD’s general population prevalence, which was found to be 1.96% for males and 0.50% for females (4-18 years of age).
If readers might reflect back on risk ratios (also described as relative risk expressed as a ratio) and use of probability nomograms. If this were done, the diagnostic value of a positive family history becomes obvious (see Chapter 2). Let’s perform some simple calculations. For example, let’s look at a boy being considered for the prospect of ASD who has an older sister with a previously established ASD diagnosis. To determine his extra risk attributable to family history, he needs to be contrasted with a boy the same age free of the same family history. The rate of ASD for the first boy (the one with an affected sister) is roughly 17%, as Table 11.3 indicates. In contrast, the rate of ASD for the second boy (the one with no affected sister) is roughly 1.96% (the general population ASD prevalence rate).
A risk ratio associated with the first boy’s circumstances is thus simply the ratio of these two rates. This “risk ratio” can be determined by 17.0/1.96 or approximately 8.7. What about an evaluation of a girl for suspected ASD who happens to have an older brother with an established ASD diagnosis? The same steps are followed. The ASD rate among girls generally is .50%. Among those with an affected older brother the rate, as seen in Figure 11.4, is roughly 4.0%. The calculation of this girl’s risk ratio would thus turn out to be 4.0/.05 or 8.0. These values can be used to nudge ASD probabilities upward, just as positive rating scale scores can. As you saw in Chapter 2 and Chapter 4, risk ratios can be entered into the center column of probability nomograms.
Table 11.3 Risk of ASD when a Biological Sibling Already has ASD |
|||
| Relationship among siblings | Percent recurrence | Relative risk | Estimated effect size of relative risk |
| Older sister with ASD and her younger brother’s risk | 16.7% | 8.5 | Moderate |
| Older brother with ASD and his younger brother’s risk | 12.9% | 6.6 | Moderate |
| Older sister with ASD and her younger sister’s risk | 7.6% | 15.2 | Large |
| Older brother with ASD and his younger sister’s risk | 4.2% | 8.4 | Moderate |
| Recurrence risk data from Palmer et al. (2017). For illustrative purposes, relative risk calculated assuming general population ASD prevalence of 1.96% in boys and 0.50% in girls. | |||
Broadband Rating Scales and Autism
Many school psychologists have their standard practices, which they follow in nearly all of their assessment cases. This means a fixed set of procedures is supplemented only as needed. Thus, it’s common to have BASC-3, Conners CBRS-3 or ASEBA’s CBCL and TRS scores in hand when autism becomes a consideration. But how truly helpful are these popular options in helping to rule in or rule out autism?
Behavior Assessment System for Children-3
Let’s start with the vastly popular BASC-3. There seem to be two especially relevant scales, the Autism Probability Index and the Social Developmental Disorders scale. Regarding classification validity, the manual depicts average scores collapsed across a clinical sample (this helps to get at the idea of group differences). But the BASC-3 manual provides no diagnostic utility statistics. The manual goes on to assert that “the presentation of group score profiles gives added empirical support for the use of the BASC-3 in identifying behavioral and emotional problems” (Reynolds & Kamphaus, 2015, p. 212). But as you learned in Chapter 2, reports of statistically significant group without diagnostic utility statistics (e.g., sensitivity and specificity) fail to inform clinical decisions (this is Meehl’s and Rosen’s classical criticism you saw in Chapter 1). The same is true regarding inferential statistics (t-tests or ANOVAs comparing clinical and unaffected samples). Nonetheless, it is interesting to examine scores on the BASC-3’s Autism Probability Index for a group of already diagnosed young children. These are depicted below in the form of an effect size statistic (Cohen’s d):
- Autism sample vs. non-clinical sample = 1.56
- Autism sample vs. mixed clinical sample = .75
Scores on the Autism Probability Index are indeed quite elevated compared to representative youth (about 1.5 standard deviations). The elevation is less dramatic when compared to children with all clinical diagnoses (e.g., a homogeneous group of youth with learning disabilities, ADHD, etc.). Consequently, information in the BASC-3 manual implies that the Autism Probability Index might actually measure general psychopathology to some extent and autism somewhat more. If this is true, it would indicate that this index should not be taken to infer the presence of autism exclusively. This is all the truer in the absence of sensitivity and specificity information.

The BASC-3’s Developmental Social Disorders content scale seems to be more general in nature than its Autism Probability Index. It taps considerations like social skills, interpersonal communication, awareness of others and ability to accommodate to change (Reynolds & Kamphaus, 2015). Here is what the manual advises regarding the Developmental Social Disorder scale: “High scores on this scale may indicate symptoms of autism spectrum disorder…..or simply may reflect poor socialization” (Reynolds & Kamphaus, 2015, p. 55). Interestingly, the Developmental Social Disorders scale has been subjected to post-publication empirical study. Indeed, the teacher version of the BASC-2 (Reynolds & Kamphaus, 2004) confirmed the presence of high scores among students with autism. Specifically, Hass, Brown, Brady and Johnson (2012) studied students who were identified as having autism using the IDEA definition (n = 30) and a control group of students without a special education label (n = 28). The following Cohen’s d values are highlighted here (note that the study cites values for many more comparisons than the few listed here):
- Developmental Social Disorders (children) = 2.07
- Developmental Social Disorders (adolescents) = 1.83
In fact, group mean differences also eventuated for another BASC-2 scale. The Functional Communication scale (“…ability to express ideas and communicate in ways that others can easily understand.” Reynolds & Kamphaus, 2004, p. 64) produced the following group mean differences for the same two samples (Cohen’s d):
- Functional Communication (children) = 2.21
- Functional Communication (adolescents) =1.08
Crucially, this study offered no diagnostic utility statistics. Although the group differences above appear a bit more favorable than those of the BASC-3 manual, the study’s authors nonetheless caution, “The BASC-2 [and presumably the BASC-3] might be used as an initial assessment of behavior and social emotional functioning, which, if needed, could be followed up with more narrowly focused instruments…” (Hass et al., 2012, p. 182). To state the obvious, it is impossible to look at a BASC-3 printout (even one with PRS, TRS and SRP scores all present) and then confidently judge that autism is present or that it is not present.
More recently, Zhou, Reynolds, Kamphaus and Zhang (2022) investigated the BASC-3 as a tool in ASD identification. Some of their results appear in Table 11.4. The researchers used two values from the BASC-3 PRS and TRS. One was a combination of three scores; the other was the Autism Probability Index (which you will hear more about soon). Cut-scores were set at T = 60 and T = 55. See the table below. The numbers suggest that positive scores give a small boost the prospect that ASD is present. In contrast, a negative score provides a large to moderate reduction to the likelihood that ASD exists.
Table 11.4 Effect Sizes and DLR Values for the BASC-3 Concerning ASD |
||||
| Source of Rating | Effect size associated with positive score | Diagnostic Likelihood Ratio Positive | Effect size associated with negative score | Diagnostic Likelihood Ratio Negative |
| Parent 3 scales | Small | 4.75 | Large | .06 |
| Parent Autism Probability Index | Small | 4.61 | Large | .04 |
| Teacher 3 scales | Small | 4.10 | Moderate | .18 |
| Teacher Autism Probability Index | Small | 2.97 | Moderate | .12 |
| Source: Zhou, Reynolds and Kamphaus (2021) | ||||
Conners Comprehensive Behavior Rating Scale (Conners CBRS)
Since the topic is autism determination, a logical question concerns the classification validity of the Conners CBRS. Equally important, does the Conners CBRS provide tangible diagnostic utility statistics (sensitivity, specificity) that practitioners can use in the field (e.g., in a probability nomogram)? The answer seems to be a qualified “yes.” In fact, there is more manual-based information on autism for the Conners CBRS than its prime competitor, the BASC-3. Devised before release of DSM-5, the Conners CBRS uses terminology associated with the supplanted DSM-IV. (American Psychiatric Association, 1994). This means that one of the two relevant Conners CBRS scales retains an older title: Asperger’s Disorder scale (with 9 items). There is also an Autism Disorder scale (13 items). The Conners CBRS manual includes diagnostic utility statistics based on these two scales’ ability to predict membership in either a clinical sample of children with autism or a sample of children representative of the general population (see Table 11.5).
Unfortunately, however, the exact cut-scores used to calculate these statistics is not apparent in the 371-page manual. What’s more, the reported values arose from a small clinical group comprised of 27 children with “pervasive developmental disorder” (PDD; a general term found in DSM-IV to denote all autism-related conditions). The DLRs found in Table 12.3 imply that both the Autism Disorder Scale and the Asperger Disorder Scale work reasonably well in clinical practice. But without information on which cut-score to use, there may be no practical method of entering Conners CBRS results into a probability nomogram. Moreover the manual contains no evidence of cross-validation. All of this suggests that when a conventional T-score of 70 is used, it proves impossible to know just how well it works to classify children with autism.
Table 11.5 Effect Sizes and DLR Values for the Conners Comprehensive Behavior Rating Scale Concerning autism |
||||
| Source of Rating | Effect size associated with positive score | Diagnostic Likelihood Ratio Positive | Effect size associated with negative score | Diagnostic Likelihood Ratio Negative |
| Teacher | ||||
| Autism Disorder Scale | Small | 8.20 | Moderate | .20 |
| Asperger’s Disorder Scale | Small | 8.20 | Moderate | .20 |
| Parent | ||||
| Autism Disorder Scale | Small | 7.81 | Moderate | .16 |
| Asperger’s Disorder Scale | Small | 6.31 | Small | .21 |
| Source: Conners CBRS manual (Conners, 2010) | ||||
ASEBA Child Behavior Checklist (CBCL), Teacher’s Report Form (TRF), and Youth Self-report (YSR)
Users of the ASEBA suite of rating tools have information that might tangibly help them in considering autism. This is true even though autism receives scant mention in the ASEBA manual covering the CBCL, TRF and YSR (Achenbach & Rescorla, 2001). In fact, there is no autism scale per se among any of these three tools. Nonetheless, because the items that comprise the Thought Problems scale concern the occurrence of repetitive thinking, repetitive actions, picking at skin, strange behavior and strange ideas score elevations on Thought Problems might imply autism. In fact, the ASEBA manual indicates that Thought Problems has odds ratios of 12, 6, and 4 for the CBCL, the TRF, and the YSR, respectively. However, these values simply relate to referred vs. non-referred youth. Said another way, they fail to speak to establishing an autism diagnosis specifically.
Fortunately, there is abundant post-publication research, some of which may hold promise for school-based use. For example, Biederman and colleagues (2010) developed a rubric for combining scores on the following CBCL scales: Withdrawn, Social Problems and Thought Problems. T-scores on these three were checked for their classification validity. To do so, the researchers examined amalgamation of these scores for two contrasting groups of children: (1.) a heterogeneous group of children on the autism spectrum (e.g., autism, Asperger’s disorder) and (2.) a group of children who had been referred for mental health services without ASD. All participants had IQs > 70. Diagnostic utility statistics are presented in Table 11.6. Some of these are quite impressive, although apparently not cross-validated to permit entirely unfettered clinical application.
Table 11.6 Effect sizes and DLR values for the Aggregated CBCL scores concerning ASD |
||||
| Source of Rating | Effect size associated with positive score | Diagnostic Likelihood Ratio Positive | Effect size associated with negative score | Diagnostic Likelihood Ratio Negative |
| Total > 180 | Minimal | 1.80 | Moderate | .18 |
| Total > 195 | Small | 3.39 | Small | .29 |
| Total > 210 | Large | 15.3 | Minimal | .56 |
| Total > 225 | Large | 11.5 | Minimal | .79 |
| Based on Beiderman et al., 2010 | ||||
A Dutch study is also potentially valuable for U.S. practitioners in part because it created a 10-item ASD scale from existing CBCL and TRF items (So, Greaves-Lord, van der Ende, Verhulst, Rescorla & de Nijs, 2013). Incidentally, one of the researchers, Leslie Rescorla, is a co-author of the CBCL and TRF. This was a large study (N = 2,566) involving youth 6-17 years that fell into one of the following three groups: (1.) those with ASD, (2.) those referred for mental health services without ASD, and (3.) a community sample. Some participants may have had co-existing intellectual disability (cognitive and adaptive scores were not universally available). The heart of the study involved raw scores on the new ASD scale for both CBCL and TRF when added together (i.e., scores on 20 items for each youngster). Total raw scores were then examined at various cut-points. As you would expect, combined CBCL and TRF scores proved quite successful at distinguishing children with ASD from members of the community sample. But they were much less successful in doing so when the ASD group was compared to referred youth (i.e., a clinical rather than a control sample).
Nonetheless, at least at first blush, the DLRpositive and DLRnegative values found in the bottom of Table 11.7 would seem helpful as one element in considering an ASD diagnosis. There is something appealing about this scheme. It solves the potentially bewildering problem of integrating teacher and parent ratings that is sometimes done via some subjective (and unvalidated) method. It instead provides a rubric, and it offers quantification of how well that rubric might work in making categorical determinations of autism. That said, these are Dutch, not U.S. findings. Practitioners will need to decide for themselves on whether to use this rubric and how much to trust if they do. Incidentally, for those wishing to use the ASD scale in their own practice, CBCL and TRF items used to construct the new scale were: #1, #9, #17, #42, #62, #66, #79, #80, #84, #111.
Table 11.7 Effect Size sand DLR Values for ASEBA’s CBCL and TRF Concerning ASD |
||||
| Source of Rating | Effect size associated with positive score | Diagnostic Likelihood Ratio Positive | Effect size associated with negative score | Diagnostic Likelihood Ratio Negative |
| ASD vs. general population | ||||
| 8 total raw score points | Moderate | 5.69 | Moderate | .11 |
| 11 total raw score points | Large | 15.80 | Small | .22 |
| 13 total raw score points | Small | 3.23 | Large | .04 |
| ASD vs. clinical sample without ASD | ||||
| 12 total raw score points | Small | 2.14 | Small | .38 |
| 16 total raw score points | Small | 3.47 | Minimal | .56 |
| 20 total raw score points | Small | 4.17 | Minimal | .80 |
| Based on So et al., 2012 | ||||
Narrowband Rating Scales
As you saw in Chapter 7, there are a bevy of narrowband (single construct) scales easily used by school psychologists to tap constructs like depression and anxiety. In parallel regarding autism, narrowband scales are used in the presence of delineated autism referrals or credible emerging autism working hypotheses (e.g., when the HR Worksheet is used). Three narrowband autism rating scales are covered here: Gilliam Autism Rating Scale-2 (GARS-3), Childhood Autism Rating Scale-2 (CARS-2), and the Autism Spectrum Rating Scale (ASRS).
Gilliam Autism Rating Scale-3
The GARS-2 is made up of 56 items indicative of young persons with autism. It is suited to those from 3 to 22 years (Gilliam, 2014). GARS-3 comprises six subscales:
- Restrictive and repetitive behaviors
- Social interaction
- Social communication
- Emotional responses
- Cognitive style
- Maladaptive speech
Each item is rated on a 4-point Likert scale with the following anchors: 0 (never observed); 1 (seldom observed); 2 (sometimes observed); 3 (frequently observed). There are percentile ranks and scaled scores (mean = 10; standard deviation = 3) for each subscale. There are also two composites (termed Autism Index) as well as severity level estimates. Autism Index 4 is derived from four subscales, and Autism Index 6 is derived all six subscales. As you might sense from reading Table 11.8, norms are based on individuals ASD. Although the Autism Index score has a mean of 100 and standard deviation of 15, as scores approach the average range relative to those in the standardization sample, they become more and more suggestive of autism. Fortunately for those interested in a more complete probability analysis that includes GARS-3 scores, the manual does include diagnostic utility statistics (see Table 11.9). A cut-score of > 70 appears to have been used. Of course, school psychologists are cautioned to take the descriptions of (e.g., “unlikely,” “probable” [as seen in Table 11.8]) with a grain of salt. If you want to determine whether autism is probable, then think about base rate and all available case information rather than focusing on a rating scale score, including a composite score from the GARS-3.
Table 11.8 GARS-3 Manual Terminology Regarding its Scores |
|||
| Autism Index score | Probability of ASD | DSM-5 ASD severity level | Required supports |
| < 54 | Unlikely | — | — |
| 55-70 | Probable | Level 1 | Minimal |
| 71-100 | Very likely | Level 2 | Substantial |
| >100 | Very likely | Level 3 | Very substantial |
Table 11. 9 Effect sizes and DLR values Concerning the GARS-3 |
||||
| Source of Rating | Effect size associated with positive score | Diagnostic Likelihood Ratio Positive | Effect size associated with negative score | Diagnostic Likelihood Ratio Negative |
| Only ASD vs. typically functioning (Autism Index 4) | Large | 19.2 | Large | .04 |
| Only ASD vs. typically functioning (Autism Index 5) | Large | 31.7 | Large | .05 |
| ASD vs. ED/BD (Autism Index 4) | Large | 32.0 | Large | .06 |
| ASD vs. ED/BD (Autism Index 5) | Small | 4.6 | Large | .05 |
| ASD. vs. LD (Autism Index 4) | Moderate | 9.3 | Moderate | .18 |
| ASD vs. LD (Autism Index 5) | Large | 13.3 | Moderate | .18 |
Childhood Autism Rating Scale-2
There are two versions of the CARS-2, a standard one (suited for young children and older children with communication or intellectual impairments) and a separate option suited for high functioning individuals (Schopler, Van Bourgondien, Wellman, & Love, 2010). Both of these CARS-2 options are comprised of 15 Likert scale items. The record form is completed by the clinician for each item (domain) regarding frequency, peculiarity, intensity and duration of symptoms. Occasionally, clinicians fail to follow the manual’s rules for using the CARS-2 by permitting the form to be completed by informants. Logically, this would seem to represent a breach of standardization and compromise the rating scales’ validity. The CARS-2 provides standard scores, percentiles and cut-scores in its manual. There is an additional form for collecting information from parents/caregivers that is not scored. Favorably, the manual includes respectable sensitivity and specificity values, but these are associated with the original CARS. The manual does indicate which raw score was applied. Other researchers also report satisfactory diagnostic utility statistics attesting to the CARS’s potential to aid diagnosticians in the field (Perry, Condillac, Freeman, Dunn-Geier & Belair, 2005). This research, however, was also conducted on the original, not the updated CARS-2 (see Table 11.10).
A recent study is interesting. It shows effect size, although it may not offer results suited directly to potential nomogram users. To determine if brief ASD assessments might work, Sanchez and Constantino (2020) examined results of a 15-minute initial appointment observation standing alone to calculate scores on the CARS-2. In other words, only the subtest entitled Observations was used; CARS-2 informant ratings were never generated. Moreover, no expert diagnosticians conducted the observations (observers/raters were simply advanced students in a nurse practitioner program as well as medical residents). A cut-point comprising a raw score of 16 was applied to create the results found in this study. The key finding was that even this brief observation methodology in the hands of non-expert observers worked. In fact, these scores worked quite well in detecting most children with ASD (i.e., the sensitivity was .96). Critically, the scores worked less well in detecting those without ASD (specificity was .62). In other words, if these findings were confirmed via cross-validation, the presence of high scores would provide help to practitioners in confirming the presence of ASD. A low score, however, would be less successful regarding the prospect of correct classification for a student free of ASD. See Table 11.10 for results.
Table 11.10 Effect Sizes and DLR values Concerning the CARS-2 |
||||
| Source of Rating | Effect size associated with positive score | Diagnostic Likelihood Ratio Positive | Effect size associated with negative score | Diagnostic Likelihood Ratio Negative |
| ‡ASD vs. general population (manual) | Moderate |
6.3 |
Moderate |
.14 |
| †ASD vs. general population (manual) | Moderate |
6.2 |
Small |
.22 |
| ‡ASD vs. mixed group (Perry et al., 2005) | Moderate |
6.2 |
Large |
.07 |
| ◊ASD vs. clinical sample (Sanchez & Constantino, 2020) | Small |
2.5 |
Large |
.06 |
| ‡CARS original was used; †CARS-2 was used; ◊CARS-2 Observation was used | ||||
Autism Spectrum Rating Scale (ASRS)
The ASRS (Goldstein & Naglieri, 2013) contains 70 items set on a 5-point Likert scale. There are forms for parents and teachers. Obviously, more items help assure full construct representation and enhanced reliability. Besides a Total score, the ASRS provides subscale scores concerning the following:
- Social Communication
- Unusual Behaviors
- Self-regulation
A DSM-IV scale is also included. Quite satisfactory diagnostic utility statistics are indicated in the test manual (see Table 11.1). The manual indicates that ASRS T-scores were used, but it does not precisely indicate which cut-score was applied. In fact, the manual describes three T-score levels, any one of which might be interpreted as at least somewhat indicative of autism (and seemingly might have been applied to create the values found in Table 11.11):
- Very elevated score: > 70
- Elevated score: 65 – 69
- Slightly elevated score: 60 – 64
This again would seem to leave diagnosticians unsure about which score to use if they wished to use Table 11.11’s values in a probability nomogram. Moreover, there is no evidence that cross-validation.
Table 11.11 Effect Sizes and DLRs Values Concerning the Autism Spectrum Rating Scale |
||||
| Source of Rating | Effect size associated with positive score | Diagnostic Likelihood Ratio Positive | Effect size associated with negative score | Diagnostic Likelihood Ratio Negative |
| Parent | ||||
| Total score | Large | 10.2 | Large | .09 |
| Social/communication | Moderate | 8.7 | Moderate | .14 |
| Unusual behavior | Moderate | 9.5 | Large | .06 |
| Self-regulation | Moderate | 5.7 | Moderate | .18 |
| DSM | Large | 23.2 | Large | .07 |
| Teacher | ||||
| Total score | Large | 11.2 | Moderate | .11 |
| Social/communication | Large | 11.2 | Moderate | .11 |
| Unusual behavior | Moderate | 8.0 | Moderate | .13 |
| Self-regulation | Moderate | 6.6 | Moderate | .16 |
| DSM | Large | 11.2 | Moderate | .11 |
| Adapted from ASRS manual (Goldstein & Naglieri, 2013) | ||||
Hybrid Direct Observation Techniques and Specialized Tools
As you know, rating scales are convenient, expedient, and vastly popular. But they also suffer limitations—rating scales necessarily require candid, unbiased, and accurate informant input. Although most teachers are excellent observers of their students’ commonplace behavior, few of them are trained in the nuanced atypicalities and social limitations that define autism. Parents suffer similar and sometimes even more consequential limitations. Living over a long time with a child who seems to be expressive autism-like behavior can understandably sometimes prompt harsh ratings. Thus, autism symptomology might be over-rated. On the other hand, a desire to protect their child or avoid stigmatizing a family member sometimes pulls parents’ ratings in the opposite direction. Autism symptomology might be under-rated. Either tendency can occur outside of conscious awareness. What might be done? Psychologists are apt to respond to problems like this by devising structured diagnostic techniques that lend themselves to quantification. Thus, much like with the advent of continuous performance tests regarding ADHD (seen in the next chapter), structured and standardized situations where autism symptoms might be provoked autism-spectrum symptoms have gained popularity. The most used of these techniques is the ADOS-2. We also cover the NEPSY-II, in part because its multi-faceted test kit may already be found in some school psychologists’ offices.
Autism Diagnostic Observation Schedule-2. (ADOS-2)
The ADOS-2 (Lord, Rutter, DiLavore, Risi, Gotham & Bishop, 2012) involves a set of five modules that are suited to various ages and developmental levels, constituting a complex system. Its modules and the children with whom each might be used follow:
- Toddler Module (ages 12 to 30 months and not yet consistently using phrase speech)
- Module 1 (ages 31 months and older not yet consistently using phrase speech)
- Module 2 (children of any age using phrase speech but who are not fluent)
- Module 3 (children who are verbally fluent up to young adolescents)
- Module 4 (verbally fluent older adolescents and adults)
Contrasting with rating scales, the ADOS-2 comprises creation and careful observation of semi-structured interactions. By the nature of these interactions, diagnosticians are afforded increased chances to document signs and symptoms of autism. As you might suspect, children with and without autism often respond differently, and these differences are made salient by the nature of opportunities arranged during the ADOS-2’s administration. The following dimensions are tapped:
- Communication
- Social interaction
- Play
- Restricted and repetitive behaviors
A coding system assists in organizing and interpreting observations. Four of the ADOS-2 modules have cut-scores to help classify children as follows: (1.) autism, (2.) autism spectrum, and (3.) non-spectrum. The module used with the youngest children (i.e., the Toddler Module), however, produces “ranges of concern” classifications only—not the more definitive continuum mentioned above.
Research on the ADOS-2’s classification validity includes some encouraging findings. Regarding that critical concern, Dorlack, Myers and Kodituwakku (2018) conducted a review of existing studies. Although too extensive to restate here, sensitivity and specificity values were often favorable. Take, for example, the findings regarding Module 3, one that might be employed by school psychologists working at an elementary school site where they may encounter verbal students for whom questions of autism exist. Regarding Module 3, Dorlack and colleagues summarize research from five studies involving 1,651 participants. Their findings appear in Table 11.12.
Table 11.12 Effect Sizes and DLRs Concerning the ADOS-2 |
||||
| Source of Rating | Effect size associated with positive score | Diagnostic Likelihood Ratio Positive | Effect size associated with negative score | Diagnostic Likelihood Ratio Negative |
| Pooled values (fixed effects) | Small | 3.28 | Small | .24 |
| Pooled values (random effects) | Small | 2.92 | Small | .25 |
| Source: Dorlack et al., 2018 | ||||
From Table 11.12, it’s obvious that the ADOS-2 provides meaningful clinical utility statistics. But the ability to correctly classify seems generally more modest than the rating scales reported earlier in the chapter. Perhaps more surprisingly, ADOS-2 values appear to be substantially below the ratios (roughly 8) that you saw concerning family history and autism recurrence risk. Methodology used in the ADOS-2, which does not rely on informants, may be one reason that some autism experts working at specialized centers contend that the ADOS (now ADOS-2) constitutes a “gold standard” for autism diagnosis (Ozonoff, Goodlin-Jones & Solomon, 2007).
Practically speaking, interested school psychologists may need to take steps to assure that reliable (and hence valid) ADOS-2 scores are regularly produced. Focused training may be needed. Specifically, the test publisher, Western Psychological Services, offers two-day workshops that include awarding of an ADOS-2 certificate. Some writers/researchers suggest that the ADOS-2 is best used by experts (e.g., professionals specializing in autism and developmental disabilities). Consider the following: “In the hands of specialized experts, the diagnostic accuracy of the ADOS-2 is acceptable. However, extensive experience and supervision concerning the assessment procedure and calibration for the coding is crucial…. examiners and entire clinical teams tend to ‘drift’ with their ADOS codings. Thus, it is important to be involved in calibration with different teams and organisations.” (Kamp-Becker et al., 2018, p. 1204).
Parallel concerns have been voiced about inter-rater reliability in natural (not specialty centers or research sites), suggesting continued training of users is needed (Zander et al., 201). The soundness of ADOS-2 application among occasional users does not appear to have been documented by research studies. Questions about whether these considerations are offset by the prospect of unique information must be answered by each practitioner and each school district. Nonetheless, nearly one-half of practicing school psychologists recently indicated that they use the ADOS-2, at least occasionally (Benson et al., 2019).
NEPSY-II and Autism-related Scales
You heard earlier in the chapter that deficits in Theory-of-Mind (ToM) might represent a hallmark of autism. And, there is some evidence that in research settings batteries incorporating ToM might discriminate children with ASD from children with normal development as well as those with intellectual impairments (Perra, Williams, Whiten, Fraser, Benzie & Perrett, 2008). In this study, however, classification resulted from multi-part batteries (e.g., including measures of dexterity, motor planning, verbal skills), not just ToM. Plus, the study employed research tools, not commercial products.
One potential alternative is to turn to commercially-available batteries that school psychologists might already possess. The NEPSY-II (Korkman, Kirk & Kemp, 2007) is a vast array of neuropsychological measures administered in standard, face-to-face manner, often via familiar procedures (easels with pages). Some school psychologists already use the NEPSY-II for learning disability evaluations because it provides user-friendly measures of domains like memory and language (Wodrich & Schmitt, 2006). Relevant to the current discussion, the NEPSY-II has two subtests, Affect Recognition and Theory of Mind, that are intended to help locate potential psychological impairments when autism might be present. Unfortunately, the manual provides no evidence of their diagnostic utility. Still, school psychologists might occasionally use these techniques, their unclear diagnostic capabilities notwithstanding (Sally Thompson did just this in the case of Marie Koffi, as you will see later in this chapter). Also, school psychologists may see scores on these NEPSY-II subtests listed in reports prepared in clinics.
Cognitive Measurement and Autism
As already seen, many cases of autism are identified before a very young student arrives for her first day on campus. Under these circumstances, school psychologists routinely review paperwork and assist in eligibility judgements. At other times, parents or teachers initiate a referral with an unambiguous question about autism. In still other instances, an assessment is already under way when autism emerges as a working hypothesis, either standing alone or in conjunction with one or more other hypotheses. If an autism identification is made, then there is an obligation to rule out intellectual disability. High rates of comorbidity mandate that this be done. The most obvious method is to use standardized IQ tests (Sheridan & Lord, 2020). Some school psychologists, nevertheless, examine factors like language skills, academic competence, or timely acquisition of developmental tasks hoping to find strengths that they can leverage against the prospect of an intellectual impairment. This is logical. When milestones are mastered on time and/or when strong academic skills exist across reading, writing and arithmetic, formal cognitive testing may not be required.
Interestingly, many practitioners, especially those new to the field, seem to doubt that students with autism can be fairly tested (i.e., with standardized cognitive measures). This doubt is likely well intended but probably unwarranted. In practice, it is common to find that children with autism score poorly on IQ tests. Critically, however, these very children may actually score even more poorly on other standardized procedures, including those that require no face-to-face test performance. This is evident when school psychologists find scores on informant-completed adaptive behavior scales lower than those on (presumably unreasonably pessimistic) IQ tests.
Anecdotes that school psychologists share with one another about relatively low adaptive scores coupled with relatively high IQ scores appear to be confirmed by empirical studies. For example, when a group of “high functioning” children with autism were administered Wechsler IQ tests and Vineland Adaptive Behavior Scales, full scale IQ scores (mean = 98.5) overwhelmingly surpassed adaptive behavior mean scores (communication = 81.2, socialization = 70.6, daily living skills = 75.3; Black, Wallace, Sokoloff & Kenworthy, 2009). If IQ tests are unfair, then it is illogical to see scores so much worse on measures independent of their actual performance than during one-on-one testing. Instead, it seems more plausible that developmental problems are common and that they are in fact indexed by IQ scores for these particular children, just as they are for children in general. That said, research shows that among high functioning individuals with autism that full scale IQ may sometimes suffer because of low processing speed scores (e.g., WISC-IV PSI; Oliveras-Rentas, Kenworthy, Roberson, Martin & Wallace, 2012). Diagnosticians, thus, probably should carefully consider students’ entire cognitive profile, not just a composite IQ score.
A bit of caution is needed, however, regarding the capability of standardized IQ tests. Although it is true that they can rule out intellectual deficits, and also provide language indicators with their Verbal Comprehension Index score, they are not diagnostic of autism itself. In other words, looking for a WISC-5 pattern that might indicate a likelihood of autism is probably futile (at least, this practice is not empirically substantiated). A number of years ago, researchers detected an interesting pattern among high functioning individuals with autism. It consisted of Wechsler IQ test verbal IQ < non-verbal IQ with the lowest subtest scores on Comprehension and the highest subtest scores on Block Design (Siegel, Minshew & Goldstein, 1996). To their credit the researchers did not propose using this pattern to help detect autism. Instead, they tested the profile’s ability to accurately diagnose true cases and avoid diagnosing false cases. They found that this test configuration failed to work well.
Much more recently, the same type of investigation concerned a later edition the Wechsler IQ test (the WISC-IV; Wechsler, 2003). Styck, Aman and Watkins (2018) tested the diagnostic accuracy of a configuration represented by WISC-IV General Ability Index (verbal reasoning + non-verbal reasoning) higher than the Cognitive Proficiency Index (working memory + processing speed). The authors found low diagnostic accuracy (e.g., an unacceptably high rate of false positives) when they applied a rubric to students with and without autism. Consequently, they recommended against use of this WISC-IV pattern in making autism determinations. In parallel, researchers using the DAS-II concluded that even though at a group level youth with ASD scored poorer on verbal than nonverbal abilities, profile differences are not useful for decisions about ASD in individual students (Clements, Sparding, Schultz, Yerys & Wakkins, 2020). IQ tests are invaluable tools, but they need to be used with restraint and good judgement when autism is a possibility (just like in every other instance).
Student Interviews
Routine interviews of the student make sense, including when autism is considered. For many school psychologists, this involves using something akin to the generic interview you learned about in Chapter 9. According to this approach, both nomothetic and idiographic perspectives are considered. Let’s consider the nomothetic ones. Questions about autism’s presence and its expression (e.g., severity, comorbidities) are nomothetic (i.e., the process of making sense out of one student based on what is known about many). But efforts at symptom confirmation vs. disconfirmation are logically different for autism than for internalizing conditions like depression or anxiety. Regarding the latter conditions, interviewers may inquire directly about feelings of sadness or low self-esteem (regarding depression) and they might do the same regarding worry or apprehension (regarding anxiety). In some cases, these are things known only to the individual himself.
But the cardinal symptoms of autism/ASD may not lend themselves to the same manner of direct inquiry. Many interviewers correctly doubt the wisdom of asking a child if he fails to take turns during conversations or if he sometimes engages in stereotypies or echolalia. He may not know, he may not fully grasp the question, he may not choose to disclose. Nonetheless, the MINI-KID (Sheehan et al., 2010), which you saw in Chapter 9, proceeds to inquire about autism symptoms directly with an individual by using just a few standard items concerning autism (referred to as PDD in the MINI-KID system). But this practice does not appear to be used very often by school psychologists (Benson et al., 2019).
What then might be gained from a child interview regarding the bottom line, yes/no question of autism’s presence? It’s largely a chance to observe in the context of a conversation. In other words, a conventional interview provides a potentially-rich opportunity to witness if the child expresses the deficits in social interaction and communication that partially define autism. The same is true regarding restrictive interests and patterns of behavior. Illustration 11.2 provides an abbreviated interview conducted by Sally Thompson with Marie Koffi (more elements of this same case appear later in the chapter). Because many children with autism (i.e., those with adequate verbal and cognitive abilities) suffer problems with pragmatics, an interview can prove illuminating. This is especially true if conducted in a manner akin to a conversation rather than an interviewer dictated interrogation.
Indeed, research confirms that high functioning individuals with autism struggle with several aspects of conversation: managing conversational topics by producing pertinent comments; information management, such as responding to a listener’s needs with the right amount of information; reciprocity, maintaining a balanced back-and-forth exchange (Paul, Orlovksi, Marcinko & Volkmar, 2009). Of course, employing formalized procedures such as the ADOS-2 might provide a chance to observe these aspects of conversation (and even to deploy a formal instrument to measure them, such as the Pragmatics Rating Scale; Landa, Piven, Wzorek, Gayle, Chase & Folstein, 1992). Again, however, for most school psychologists under most circumstances, a typical interview is likely to occur and it, not something more elaborate, will be used to watch for social communication deficits.
Illustration 11.2 Partial Interview by Sally Thompson’s of Marie Koffi
SCHOOL PSYCHOLOGIST: (Sally Thompson): Thanks for coming in again today.
MARIE: Okay.
SCHOOL PSYCHOLOGIST: (Looking at Marie): I always hated it when people disturbed my summer vacation.
MARIE: (Without looking in Sally’s direction, she makes no response)
SCHOOL PSYCHOLOGIST: I would like to remind you about our earlier rules regarding confidentiality. Do you remember them?
MARIE: Yes.
SCHOOL PSYCHOLOGIST: Do you agree to speak with me today following those same rules?
MARIE: Yes.
SCHOOL PSYCHOLOGIST: Let me ask you a couple questions about your family (looking at Marie).
Marie: (Looking at Sally but saying nothing)
SCHOOL PSYCHOLOGIST: Can you tell me who lives in your house and their ages?
MARIE: My dad, 42, my mom, 41, and my brother Jean-Marc, nine.
SCHOOL PSYCHOLOGIST: (Looking at Marie): Oh, actually now that you say this I think I did already read this information in your file.
Marie (Looking at Sally but says nothing)
SCHOOL PSYCHOLOGIST: Do you have any family pets?
MARIE: Yes.
SCHOOL PSYCHOLOGIST: Can you tell me about them?
MARIE: There is only one, a German shepherd named Rex.
SCHOOL PSYCHOLOGIST: Oh, I love dogs. Are you a dog lover?
MARIE: Yes.
SCHOOL PSYCHOLOGIST: Can you tell me a little bit about your class last year? I think the name of your school last year was Sumner, right?
MARIE: It was okay.
SCHOOL PSYCHOLOGIST: What can you tell me about your classmates at Sumner?
MARIE: There were boys and girls. Slightly more girls than boys. We were all in the same class together for every class all day long.
SCHOOL PSYCHOLOGIST: I don’t know if I would like being with the same group of kids all day long.
MARIE: It was okay.
SCHOOL PSYCHOLOGIST: So, lunch in the cafeteria or brought from home?
MARIE: Always brought from home. I’m not eating that dog food served in the cafeteria.
SCHOOL PSYCHOLOGIST: If you could pick out a favorite friend and do one activity with them, what would you pick out?
MARIE: Well I don’t really have any friends since we moved.
SCHOOL PSYCHOLOGIST: Well just tell me about last year then.
MARIE: Charlotte playing Sim City 3.
SCHOOL PSYCHOLOGIST: Sounds like fun.
MARIE: You get to build your own world. The game can go on a long time. And it actually seems quite realistic.
SCHOOL PSYCHOLOGIST: So now a different kind of question. What kind of job would you like to have as an adult?
MARIE: A meteorologist. I think that would be the best job in the world. It’s so interesting and there is so much to know and they have so many cool things that they look at.
SCHOOL PSYCHOLOGIST: You mean like a meteorologist who reports the weather on TV?
MARIE: Well, those people are meteorologist technically. But they’re mostly entertainers and performers. I wouldn’t want to do that job. Plus, they have extremely terrible hours. For example, the CBS station in Boston comes on the air 4:30 in the morning. This means the meteorologist would need to be in the station by no later than 4:00 in the morning. So if you think about it, with a half-hour drive you would have to leave your home at 3:30. That means you probably have to get up at 2:30 or so. I don’t mind getting up early in the morning, but this seems too early for me. Plus you could run into unexpected traffic. You could have car trouble. There could be an icy road, a flooded road or road construction forcing you to have to drive very slowly.
SCHOOL PSYCHOLOGIST: Oh, so you would like to be a meteorologist somewhere else, right?
MARIE: Yes. Working for the National Weather Service. Technically, the National Weather Service is part of the National Oceanic and Atmospheric Administration. Both of these are part of the United States government. They hire a lot of meteorologists. The meteorologists are U.S. government employees. Lots of meteorologists are needed because the National Weather Service has to keep track of so many different things. They have to do it every day and all day long. For example, they have to keep track of each city’s temperature, humidity, atmospheric pressure, and UV index during the daytime. But they don’t have to track the UV index at night. They also have to make weather forecasts and pass this information on to the public such as radio and TV stations. The weather announcers don’t think up any of the things they say on their own. They get it from the National Weather Service.
SCHOOL PSYCHOLOGIST: So, when we see this information on our TV it’s coming from the National Weather Service. Interesting.
MARIE: But that’s not all the National Weather Service does. They have a lot of advisories that they need to be prepared to report to each geographic area. These go to TV and radio stations but now days they also go out as text messages. The texts often have an alerting sound that is really loud. Watches and warnings are important so having a loud sound is really worth it. You don’t want to miss a warning. A watch is not so bad to miss, but you should still probably listen closely when they come through. Technically, the National Weather Service provides notices in two forms: watches and warnings. A warning is a higher level of alert than a watch. Watches and warnings go out from the National Weather Service for things like high wind warning, flood warning, hard freeze warning, red flag warning, winter storm warning, and hazardous seas warning. Any time one of the watches or warnings gets made, it’s a meteorologist doing it. I think being a meteorologist for the National Weather Service would be an important job. I think it would be a lot of fun. And I think I would probably like to do it as a career.
The interview proceeded for another 15 minutes, touching on various topics much like you saw in the Generic Child Interview form of Chapter 9.
A final word about interviewing is necessary. Parents and teachers, of course, are essential informants in cases of suspected autism. Interviewing them, not just handing them a blank rating scale, makes sense. School psychologists might simply address directly the criteria for DSM-5 or IDEA when speaking with parents or teachers (Sally Thompson’s preferred path, as you will see later). But some school psychologists may opt to use a structured interview technique that is specific to autism, such as the Autism Diagnostic Interview-Revised, ADI-R; Lord, Rutter & LeCouteur, 1994). The ADI-R use, however, requires both preparatory training and a large time commitment for administration and scoring (Sheridan & Lord, 2020). Thus, the ADI-R’s use might be restricted to school psychologists specializing in autism assessments.
Parental Feedback
One part of parental feedback seems to prove especially tricky–it’s how to address any medically-related questions of autism generally or any concern in an individual student particularly. Things would be simple if a physician team member existed, but in schools this is almost never the case. What do you, the school psychologist, do?
It might be appropriate to tell a parent candidly that your assessment represents just a delimited evaluation, one done to permit educational classification and to open doors to specialized services. If you do this, might you suggest that parents seek medical consultation on their own because the school has no in-house method of addressing this? Do you send a copy of your report to the student’s primary care physician with the expectation that she will review it and either use her clinical judgment about whether more medical services are needed (e.g., genetic studies for this child; counseling about family planning)? Might you even make a summary referral onward to a specialist (e.g., child neurologist, geneticist)? Do you find some other option? No matter what you decide to do about the questions raised above, when meeting with parents you may want to explain the nature of autism and be prepared to dispel myths about it. Use of an authoritative website, such as a link to NIH might be worth considering (https://www.ninds.nih.gov/Disorders/Patient-Caregiver-Education/Fact-Sheets/Autism-Spectrum-Disorder-Fact-Sheet, retrieved November 24, 2020).
You may also need to think broadly about your responsibility to families on topics only rarely considered by school psychologists. To this latter point, consider the Smithfield family presented in Illustration 11.3.
Twenty-six-year-old Brooke Smithfield and her 27-year-old husband, Justin, took the news stoically when they learned from her school’s evaluation team that their six-year-old daughter, Iris, has autism. They were happy on the one hand to finally have a label for her baffling symptoms. They were deeply concerned on the other hand about her future. When Mrs. Smithfield was interviewed during the assessment process, she volunteered that she hoped to give birth to several more children, a prospect that had been set aside until the family gained “closure on Iris’s situation.”
Although perhaps not obvious, there is a potential hazard lurking over the Smithfield’s future—the risk that autism will occur in a yet-unborn sibling(s) of Iris. This is the topic of “recurrence risk”. Consider the words of experts on developmental disabilities that ring just as true today as when written two decades ago, “Underdiagnosis [or under-sharing of facts] also has important consequences for families and individuals….families of such individuals thus remain unaware of the potential for this condition to recur in future generations” (Dykens, Hodapp & Finucane, 2000, p. 55). In fact, empirical research involving parents of youngsters with DD implies the role of genetics often does go underappreciated (Kiely, Vettam & Adesman, 2019).
If Mr. and Mrs. Smithfield choose to enlarge their family, doing so is of course entirely their option. And, what’s more, their actual thoughts on the topic are none of our business. Notwithstanding these realities, the Smithfields are entitled to plan their family with full disclosure from professionals with whom they are in contact. This arguably includes the school psychologist who may have been the one to indicate that Iris has autism. Accordingly, consider thinking broadly about your communication with parents and be prepared to send them to authoritative sites where they can learn about all aspects of autism, including implications for family planning. Relatedly, consider sharing your findings with the pediatrician caring for Iris, an individual who may herself be better positioned to address child planning as part of her practice responsibilities (see the actions of Sally Thompson in Appendix C).
A primary care physician may address delicate topics like this or even, depending on circumstances, refer the Smithfields onward to a genetic counselor (someone prepared to discuss recurrence risk with parents; Woodbury-Smith & Scherer, 2018). Beyond general websites addressing autism, a primary care physician might even alert parents to a fact sheet about recurrence risk
Tying up Loose Ends Regarding Autism Identification in Schools
To recapitulate, several steps should be taken to steer the assessment to a proper high stakes decisions like one involving autism. Specifically, the following would seem to be routinely required:
- Record review, including cumulative file and parent-completed social and developmental history
- Access to health records and family history
- Discussion with primary care physician or access to her records concerning the student
- Classroom observation
- Cognitive and academic testing (or rule out of cognitive delay by record review)
- Student interview
- Narrowband scale (e.g., Autism Spectrum Rating Scale) completed by teacher and parent
- Autism Diagnostic Observation System-2 (optional)
These steps can be chronicled on the HR Worksheet or they might be documented in some other manner that assures reflective analysis. Alternatively, school psychologists might use probability nomograms. This would first involve site-specific estimation of autism’s base rate–the left column of the nomogram. Subsequently, probability nomograms would be completed, such as sequentially adding DLRs and relative risks associated with a family’s history of autism, teacher-completed narrowband scales and parent completed narrowband scales (and potentially ADOS-2)—each entered into the middle columns of reiteratively updated nomograms. In either of these information analysis scenarios, the culmination is a probability estimate of autism’s presence. In the former (HR approach), it is qualitative in the form of an approximate probability of autism. In the latter (probability nomograms) it is quantitative—the right column of the final probability nomogram.
Critically, neither approach actually confirms the presence of autism (IDEA) or ASD (DSM-5)—both approaches indicate probability. For most school psychologists, most of the time, autism identification concerns working with a team to satisfy an educational definition—usually the IDEA definition of autism. In fact, each state’s autism definition may depart a bit from IDEA’s wording (you must know each of the precise elements that make up your state’s eligibility). Occasionally, however, school teams may be involved in establishing a DSM-5 diagnosis (i.e., ASD) so that 504 protections can be afforded. Both of these determinations should be made at the conclusion of a multi-step process. In fact, the HR Worksheet prompts you to accomplish this very task (i.e., after reaching the Final Stage, the H-R Worksheet nudges you to address “Administrative Considerations”). For these reasons, a final, confirmatory step is required. In other words, even in the face of high probability estimates after all information is considered, a checklist comprising either IDEA or DSM-5 criteria should be routinely completed. Only with element-by-element verification is a final conclusion fairly reached (after all, you are certifying that these criteria are satisfied).
An Autism Case: Marie Koffi and Sally Thompson
As you remember, Sally Thompson was trained in a clinic setting. During training she saw many cases of emotional and behavioral problems. She also performed several evaluations of children with suspected autism. Let’s see what Sally’s evaluation looks like. Appendix C contains Sally’s final written report. You now have a method of judging whether the evaluation complies with the guidance found in this chapter. In Chapter 14, you will hear about preparing written reports. Sally’s report about Marie Koffi represents an introduction—and a point for critique regarding the information sharing obligation that attends all school psychology assessment practices.
Summary
School psychologists are often involved in identifying students with autism. Sometimes there is an explicit referral question about the condition. At other times, hypotheses about autism emerge following a broader referral question. In either instance, background information, observation, interview of stakeholders, child interview and rating scales should be used. Probability nomograms are especially well suited to questions about autism. More than other social-emotional conditions covered in this chapter, autism is associated with medical conditions, suggesting the prospect of medical involvement. In addition, intellectual disability is a risk for children with autism; this possibility should be ruled out in each case. For school psychologists, both the formal DSM-5 criteria for autism spectrum disorder or the IDEA definition of autism should be addressed point-by-point if special services or formal Section 504 accommodations are contemplated.