
7 Narrowband Scales
Key takeaways for this chapter…
- Unlike their broadband counterparts, narrowband scales provide an in-depth measurement of just one dimension
- Popular narrowband scales for school use include those assessing anxiety and depression (covered here) as well as those assessing autism (covered in Chapter 11) and ADHD (covered in Chapter 12)
- To maximize efficiency and to minimize false positives, narrowband scales might be restricted to helping confirm or disconfirm existing hypotheses
- Narrowband scales often surpass broadband scales regarding construct representation, reliability and validity
Cases/vignettes in this chapter include…
- Serena Johnson, learning about the circumscribed role of narrowband scales
- Breanna Taylor, a student whose parents need convincing
- Judy, trauma considered with or without a narrowband scale
A logical complement to broadband rating scales (Chapter 5) is an array of assessment tools often described as narrowband. Whereas broadband scales address multiple dimensions, narrowband scales tap just a single dimension (or sometimes a very few inter-related dimensions). In this chapter, you will learn about several narrowband rating scales that might be completed by teachers, parents, or the child herself. Many of these scales concern internalizing dimensions, such as anxiety or depression. Narrowband scales used for ADHD and autism, which are also important, are covered in later chapters (i.e., ADHD in Chapter 11 and autism in Chapter 12). Before turning to the particulars of narrowband rating scales, however, a case illustrates some features and reveals one potential pitfall associated with their use.
Serena Johnson and Use of a Narrowband Depression Scale
Serena Johnson is a fourth-year school psychologist. She works in a suburban high school where she provides an array of services. Serena recently attended a continuing education program that concerned depression. A cornerstone of the workshop involved assessment, including review of several narrowband rating scales. As the session went along, Serena was chagrined at her lack of prior knowledge about depression. More troubling, she questioned whether she may have sometimes failed to detect students who actually suffered noteworthy depression. Ever conscientious, Serena promised herself to gain proficiency in the use of self-report depression scales and to henceforth routinely employ them in her practice.
Serendipitously, she received a referral for an SLD assessment soon after returning to campus. Serena proceeded with the evaluation, which involved a bright 16-year-old girl with adequate general cognitive capability but with remarkable deficits in visual-spatial processing. Worse, the girl appeared to evidence almost no sense of numerosity. She simply could not envision groups of items or sense relationships among numbers or quantities. Not surprisingly, this pattern matched her long-standing history of math difficulty. Individually-administered math tests confirmed quite striking deficits. In light of the accumulated information, this young lady looked like a strong candidate for SLD services.
Serena kept working, however, so as to conduct a thorough evaluation. This meant that she observed the student in math class twice and in a biology class once. Nothing noteworthy was observed. The girl’s family history was positive for learning disabilities (her father had also struggled in math) but there were no family problems with mental health. Specifically, neither parent, nor a younger sibling, had ever experienced behavior problems, anxiety, depression, or disturbed thinking. Likewise, there was no family history for autism or ADHD. Additionally, Serena discovered that the student mastered developmental milestones on time. She had experienced only minor health problems, mostly seasonal asthma. She had always passed hearing and vision screenings. Her school’s cumulative record documented adequate performance on all high-stakes tests, with the exception of consistently below-average scores in mathematics.
At this point in the assessment process Serena would have typically administered a broadband rating scale to rule out social-emotional difficulties. In the present case, however, she decided to use a narrowband scale that addressed only depression. Although not fully admitting it to herself, Serena might have chosen this path in part to boost self-learning. In a girl with no obvious risk of depression, why not just administer a depression scale to get a feel for how it works? Consequently, Serena administered the Reynolds Adolescent Depression Scale-2 (RADS-2, Reynolds, 2002). Serena was surprised when the RADS-2 was scored and there was a significant score elevation. Specifically, the Depression Total T-score was 66 +/-5.5. The score was above a suggested manual cut-off level (T-score > 65). Now that she is confronted with an elevated narrowband score, how should Serena interpret it? On the one hand, maybe this narrowband scale fortuitously succeeded in detecting an unknown instance of adolescent depression. On the other hand, as may be obvious to you, Serena is on the verge of committing a critical error of diagnostic decision making. As you learned in Chapter 2, it is a mistake to ignore pretest probabilities and to neglect considerations like base rate. It is true that this student expresses a rating scale elevation. It is false, however, to assume that this elevation alone makes the presence of depression compellingly probable. At a minimum, Serena ought to consider the base rate for depression among students referred for SLD evaluations at her site.
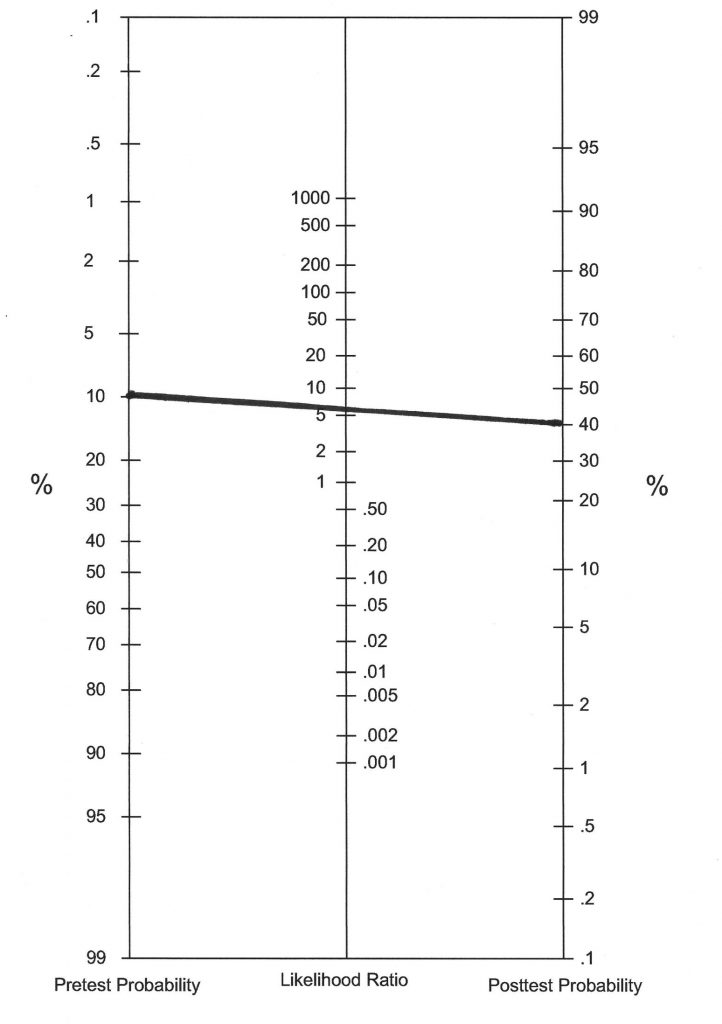
One way to illustrate the consequence of Serena’s action is with a probability nomogram. Figure 7.1 demonstrates that with a low pretest probability (perhaps simply reflecting a depression base rate estimate among SLD students in Serena’s school district), that only a modest post-test probability would arise. This is true even a strong Diagnostic Likelihood Ratio associated with a positive depression test score. Simply put, with a pretest probability of 10% and a DLRpositive of 6.2 (for illustrative purposes), Serena’s student is more likely not to have depression. All of this points out something important. Narrowband scales should not be used for screening purposes. Serena had no prior hypotheses regarding depression. She merely selected a depression scale out of thin air. In doing, she incurred a disproportionate risk that the score elevation would represent a false positive. This is another reason for using the HR approach (see Chapter 2) or any other approach that requires step-by-step information management (e.g., a probability nomogram). Puzzled by her findings, Serena discussed the case with a senior colleague. Her sage associate suggested the prospect of a false positive but also suggested an interview to verify that supposition. In the final analysis, in face of no substantiating interview evidence, Serena concluded that depression was absent.
Things to Keep in Mind when Using Narrowband Scales
If narrowband scales create inadvertent risks for false positives, a logical question is why use them at all? There are at least five reasons for their adoption over just counting on broadband scales. These are: (a.) expert authorship, (b.) superior reliability, (c.) superior validity, (d.) potential as a “resolver” test (e.) superior insights for upcoming clinical interviews.
Expert Authorship
Narrowband tests typically are constructed by topic-specific experts. Consider a narrowband scale you will hear a lot about in Chapter 12, the ADHD-5 Rating Scale (DuPaul, Power, Anastopoulos & Reid, 2016). Each author has at least a quarter-century of focused work on ADHD. George DuPaul, for example, has published more than 100 peer-reviewed articles concerning ADHD. He has authored well-received books about ADHD in schools (e.g., DuPaul & Stoner, 2014). He coauthored the NASP position paper on ADHD and was on the committee that wrote ADHD practice guidelines for the American Academy of Pediatrics. Similarly, William Reynolds, author of the Reynolds Adolescent Depression Scale-2, possesses a vast scholarly record regarding childhood depression. Like DuPaul and ADHD, Reynolds did not merely dabble in childhood depression and then construct a scale to measure it. His depression scale authorship is part of a lifetime pursuit. Although it is true that scholars also create broadband scales, it would be unreasonable to expect that any of them would author 100 articles on any one of the many, many domains (anxiety, depression, conduct problems, ADHD, autism) captured in their broadband scales.
Superior Reliability
All things being equal, longer tests (i.e., with more items) enjoy better reliability than their briefer tests. In fact, the effect of lengthening can be quantified by use of a formula (i.e., the Spearman-Brown prophesy formula; Bandalos, 2018). There is no need to learn the mathematics involved in scale reliability, but the logic is interesting. When a psychometric tool is comprised of just a few items, adding one additional item produces a disproportionally large boost in reliability. But for longer tools, adding one more item boosts reliability relatively little. For example, authors of an 8-item test can calculate for themselves the advantage of adding one, two, three or items. So can the authors of a 35-item test. Calculations like this help test authors determine how far to go with item additions as they trade off enhanced reliability against the inconvenience and cost to consumers of lengthier tests.
Why is this important? Because that it’s quite feasible to place 30 items in a narrowband scale for depression or create an equally lengthy narrowband anxiety scale. But it would prove impractical to deploy so many items to measure any single dimension in a broadband scale. This is because if 30 items concerned depression and another 30 items concerned anxiety, then a broadband scale would risk becoming too long by the time another 8 or 10 dimensions were added. Indeed, the narrowband Revised Children’s Manifest Anxiety Scale (RCMAS-2; Reynolds & Richmond, 2008) encompasses 49 anxiety items. In contrast, the broadband BASC-3 Self-Report of Personality Anxiety (SRP) scale contains just 11 anxiety items. The advantages inherent in longer tests become apparent with side-by-side comparisons (see Table 7.1). At the top of Table 7.1, one sees the screener (short-form) of the Reynolds Childhood Depression Scale-2 contrasted with the much longer standard form. In the bottom, one sees a comparison of a relatively narrow index (designed to assess for Generalized Anxiety Disorder only) and a composite on the Multi-dimensional Anxiety Scale for Children-2. Note that the magnitude of the reliability coefficient grows and correspondingly the width of the confidence interval (which is dependent on SEM) shrinks in the presence of more items.
Table 7.1 Comparison of Long and Short Versions of Narrowband Scales: Effect on Reliability |
|||||
| Reynolds Childhood Depression Scale-2* | |||||
| Short-form | Standard form | ||||
| Number of items | Reliability coefficient | SEM | Number of items | Reliability coefficient | SEM |
| 11 | .86 | 3.87 | 30 | .91 | 3.16 |
| Multi-dimensional Anxiety Scale for Children-2§ | |||||
| Generalized Anxiety Disorder Index | Total score | ||||
| Number of items | Reliability coefficient | SEM | Number of items | Reliability coefficient | SEM |
| 10 | .66 alpha | 5.25 | 50 | .88 alpha | 2.86 |
|
*Values reported for total sample §Values reported for self-report, 12-15 years, genders combined
|
|||||
Superior Validity
As you just heard, the RCMAS-2 (Reynolds & Richmond, 2008) contains 49 items. The first advantage of longer tests concerns content validity and full construct representation, a topic covered in Chapter 1. Relatively long scales, such as this one with 49 items, help assure full construct representation. In other words, there are enough items to inquire about all aspects of the construct of anxiety. Specifically, the authors parse the construct into three components. Given its length, the RCMAS-2 has plenty of items available to fully assess each of these three elements:
- Physiological anxiety
- Worry
- Social anxiety
Short tests, in contrast, risk having insufficient items to measure all aspects of mental health diagnoses like anxiety, depression, PTSD, or ADHD. Contemplate the coverage limitations inherent in the 11 anxiety items found on the BASC-3 (SRP). When too few items are available to cover an entire construct of interest, then there is said to be risk of “construct underrepresentation.” Incidentally, because broadband scales are obliged to cover so many areas, they typically do not carefully define each construct or delineate its subcomponents. This fact further raises the risk to full and adequate construct representation among broadband scales, a problem largely circumvented by their narrowband counterparts.
The second advantage follows from longer tests’ influence on reliability. Reliability is necessary but not sufficient for validity (Bandalos, 2018; Cronbach, 1970). Reliability coefficients (expressed as correlation coefficients) set the upper bound on validity coefficients, such as the correlation between one scale and another scale (or objective criteria). Specifically, it turns out that a validity coefficient can be no greater than the square root of the reliability coefficient (Lester & Bishop, 2000). Thus, if a reliability coefficient for a measure of anxiety is .80, then a validity coefficient for that measure can be no larger than .89. Similarly, if a reliability coefficient is .40, then a validity coefficient of that same instrument is bound to be .63 or less. This is sometimes referred to as the Index of Reliability (Lester & Bishop).
Reliability’s restraint on validity, setting aside temporarily the numbers, makes intuitive sense. If a teacher fills out a 3-item depression scale with a raw score of 1 on Monday, and a raw score of 3 for the same student on Tuesday, then scores on this scale are not very reliable. Think about the chances that a scale with wildly fluctuating scores is able to adequately (validly) measure anything. For example, much of what the unreliable test scores reflect is randomness (noise). With so much noise, there is little substance being measured beyond randomness and thus little substance that is capable of correlating with other tests (or important criteria) so as to verify validity. Chance alone (such as whether the rating happened on Monday or Tuesday) would render the 3-item scale essentially worthless in predicting something psychologically important (e.g. anxiety, depression).
Potential Role as a “Resolver Test”
Users of the HR Worksheet learn that hypotheses become more or less probable as additional information is collected. Consequently, it sometimes makes sense to consider one or more narrowband scales when reaching Middle Stage E on the HR Worksheet. Usually, however, narrowband scales would be restricted to addressing only hypotheses marked “probable” or “very probable” on your HR Worksheet. Otherwise, there is no reasonable (nomothetic) purpose for using narrowband scales. In fact, doing so would only unnecessarily increase the chances of a false positive (recall the lesson learned from Serena Johnson earlier in this chapter). With a probable hypothesis (e.g., depression), however, a clinical range score may afford a large dose of confirmation. In this sense, a narrowband scale might be considered to be something of a “resolver test” (Youngstrom & Van Meter, 2016). For example, a diagnostician’s reasoning might run something like this, “I think it is probable that this student is experiencing depression based on what I have learned so far, but a narrowband depression scale might help me resolve my lingering uncertainty.”
It’s hard to argue with this line of thinking. Youngstrom and Van Meter, however, counsel caution. Any chance to fill a resolver role requires that a test possess some important qualifications. One of these is evidence of classification validity (i.e., sensitivity and specificity evidence for the purpose intended). In other words, if one expects a tool is going to distinguish a child with depression from one without depression, then diagnostic utility statistics are required. Another is that the contemplated narrowband scale should also provide unique information. For example, if a depression hypothesis emerged largely because a parent’s broadband rating instrument reflected an elevated depression scale, then a narrowband depression scale completed by the same parent might do little to further confirm depression. Logically, the content of these two measures (i.e., broadband depression items and narrowband depression items) would be similar and, critically, both would have been completed from the vantage point of the very same rater. Statistically, these two measures would likely prove too highly correlated to account for unique variance. Thus, a narrowband scale might only fit if there is already a strong hypothesis, if the scale offers credible diagnostic utility statistics, and if new (unique) information is gained. These are important nomothetic considerations. Recall, however, that school psychologists are urged to consider students broadly, thinking about both nomothetic and idiographic explanations. What about serving an idiographic purpose? Read on.
Guidance for an Upcoming Interview
As you have seen, some school psychologist would use narrowband scales as a final step (e.g., Middle Stage E in the HR Worksheet). Others would continue with interviewing even after a broadband (e.g., BASC-3 SRP) scale was reviewed. This latter strategy might work well sometimes. But if you could garner helpful information for conducting a clinical interview by inspecting items from a broadband scale, you are likely to gain even more from the specialized items comprising a detailed narrowband scale. For example, on the 49-item RCMAS-2 (Reynolds & Richmond, 2008) there are quite circumscribed items that might reveal the unique aspects of an anxious child’s thinking and perceptions. Among these is an inquiry about the prospect of being laughed at. Another item addresses concern about making mistakes in front of others. If endorsed, both topics would seem germane for discussion during an interview.With so many items, the RCMAS-2 often provides diagnosticians with many opportunities to turn up something important at the item level for later interviewing purposes. Understandably, the BASC-3 SRP has nothing so specific and so differentiated to aid upcoming interviews.
Practice-Relevant Narrowband Scales
Psychologists and educators have assembled a vast array of single-construct instruments. Of course, only some of them concern childhood personality, emotions, behavior, and psychopathology. And only a relatively few of them have clinical applications. For example, in 2007 Fletcher listed 32 instruments constructed to assess children’s exposure to stressful life events (i.e., trauma). But, critically, “few …have been examined for their psychometric properties, and none had both reliability and validity assessed” (Fletcher, 2007, p. 419). The bulk of these 32 instruments were thus restricted to research or other specialized uses. In 2020, LaGreca and Danzi, list at least five PTSD scales that might be suited for use in clinic settings. One of these is covered in this chapter. But the same disconnect between abundant research tools and relatively scant clinical tools occurs concerning instruments to measure many other mental health conditions.
Consequently, this chapter reports a few instruments with applications in schools. Many are marketed by publishing companies. Some are available for free, as you will see later in the chapter. The goal is to provide a short list of clinically applicable narrowband scales covering common concerns. As you will soon see, quality varies—some provide clinical utility statistics, including information about optimum cut-scores. Others have solid norms and helpful derived scores but no information about sensitivity and specificity.
Depression Scales
Depression is a common childhood condition (an estimated 3.2% of youth have been diagnosed, according to the CDC https://www.cdc.gov/childrensmentalhealth/features/anxiety-depression-children.html (Retrieved September 7, 2020). This fact suggests the obvious; school psychologists using the H-R Worksheet will sometimes approach the final stages of case analysis with depression as a prime hypothesis. Consequently, depression rating scales can sometimes add valuable confirmatory or disconfirmatory information. Because depression is an internalizing problem, many depression rating scales are self-report in nature. This proves advantageous. In most cases, informant-based characterizations of the student are already available by this stage (e.g., BASC-3 TRS and PRS suggest that depression might already be present). Background and observation information, potentially pointing toward a depression hypothesis, are likely present as well. When a case is managed in this way, narrowband scales are sometimes described as “resolvers,” as you saw above (Youngstrom & Van Meter, 2016). As you will see in Chapter 9, child interviews are also needed when depression is a late-assessment-stage hypothesis (see the case of Dayna in Chapter 9). And, as you are learning, interviews can often substantiate items endorsed on narrowband scales (nomothetic) as well as add detail, nuance and context (idiographic).
It is beyond the scope of this chapter to systematically review all of the narrowband depression scales that might be used. Local preferences are usually driven by scales already available, cost, as well as ease of administration and scoring. Fortunately, Stockings and colleagues (2015) conducted a meta-analysis of four narrowband depression scales: Child Depression Inventory, Beck Depression Inventory, Center for Epidemiological Depression Scale-Children and Reynold Adolescent Depression Scale. The study involved a sophisticated statistical synthesis of 54 studies involving 34,542 participants. No one scale outperformed the others. Cumulatively, the scales were found to possess good internal validity and moderate diagnostic accuracy. As seen in the analysis of the various narrowband scales below, however, selection of cut-score is consequential. In some settings (such as those with a low base rate or when a test is used to screen rather than serve as a resolver) the positive predictive values (the degree to which a positive score can be trusted to denote a true case) was found to be poor. Importantly, the clinical utility statistics found in this study, which are voluminous, were calculated when the criterion diagnosis was Major Depressive Disorder. Milder expressions of depression may typically occupy school psychologists’ concerns. Thus, it does not seem justifiable to pull sensitivity/specificity data from this article to calculate DRLs such as for use in probability nomograms. But the vast number of studies reviewed by Stocking and colleagues that report sensitivity and specificity (and also consider base rate) testify to the mounting importance of these concepts. This is one reason for working systematically by refining and discarding hypotheses, remembering to consider base rate and, potentially, using probability nomograms. The key point is that when a pre-test probability is relatively high, then the risk of false positives declines. Table 7.2 summarizes narrowband depression scales, and each is covered briefly below. If you choose to use any of these scales, read its manual!
Table 7.2 Some Narrowband Depression Scales |
|||
|
Publisher |
Age Range |
Nature |
Standardization Sample |
|
Beck Depression Inventory II
|
|||
| Western Psychological Services | 13 and older | 21-item self-report | Representative and clinical samples |
|
Childhood Depression Inventory-2 (2011)
|
|||
| Multi-Health Systems |
7 to 18 years |
|
Representative youth |
|
Reynolds Child Depression Scale-2 (2010)
|
|||
| Psychological Assessment Resources |
7 to 13 years |
|
Representative youth |
|
Reynolds Adolescent Depression Scale-2 (2002)
|
|||
| Psychological Assessment Resources |
11 to 20 years |
30-item self-report | Representative youth |
|
Center for Epidemiological Depression Scale for Children (CES-DC)
|
|||
| NovoPsych |
6 to 17 years |
20-item self-report | Clinical Youth |
Beck Depression Inventory (BDI-II)
The most recent version of this inventory is suited for children 13 years and older (Beck, Steer & Brown, 1996). It enjoys popularity with adolescents (Rudolph & Lambert, 2007), perhaps because of its ease of administration and its brevity (just 21 items). Youngsters respond to items on a 0 to 3 Likert scale. Vegetative signs of depression are covered, as are affective and cognitive symptoms. Unfortunately for school psychologists, the scale does not contain items related to school. Findings summarize range of depressive symptomology (minimal depression, mild depression, moderate depression, severe depression), as well as T-scores and percentile ranks. There are also other features. One of these is a warning about “imminent risk for suicide” that might appear in the computer printout. Another is a cue to consider probing the student, when appropriate, about coping with depression by following up with a separate “hopeless” scale.
Children’s Depression Inventory-2 (CDI-2)
The CDI was originally developed based on the Beck Depression Inventory (for adults). The CDI-2 self-report comprises 28 items (Kovacs, 2010). There is a short-form version, which is unlikely to be used because its 12 items fail to improve on the coverage of depression most school psychologists already gain from popular broadband self-report scales (e.g., BASC-3). The CDI-2 has been criticized for construct irrelevant variance, such as including dimensions related to anxiety and acting out, rather than depression solely (Stocking et al., 2015). More favorably, the current version includes coverage of dimensions that signal full construct representation. This includes items concerning negative mood, physical symptoms, negative self-esteem, as well as functional considerations related to interpersonal problems and ineffectiveness.
Reynolds Adolescent Depression Scale-2 (RADS-2)
The RADS-2 is made up of 30 self-report items (Reynolds, 2002). These items are distributed across four dimensions of depression: dysphoric mood, anhedonia/negative affect, negative self-evaluation, and somatic complaints. The RADS-2 also reports a total score as well as results based on six highly discriminating items. The adolescent version (Reynolds, 2002) also includes clinical utility information, but one of the cut-scores reported (T-score = 61) seems much lower than a cut-score most school psychologists would apply in their own practice. Interestingly, T-score = 70 does not seem to be the basis for reported sensitivity and specificity statistics.
- Cut-score of T-score = 61 has “moderate” effect size associated with a DLRpositive of 6.2
- Cut-score of T-score = 67 has “large” effect size associated with a DLRpositive of 13.9
Reynolds Child Depression Scale-2 (RCDS-2)
The RCDS-2 is made up of 30-self-report items for children 7 to 13 years (Reynolds, 2010). These items appear on a Likert scale. A short-form version also exists, but it is unlikely to be used widely by school psychologists because it offers little beyond self-report scales that are broadband in nature. Interestingly, there are clinical utility statistics provided in the manual. Thus, it is possible to calculate DLRs associated with two cut-score values for discriminating youth with depression from those without (apparently a non-clinical sample).
- Cut-score of T-score = 65 has “large” effect size associated with a DLRpositive of 15.7
- Cut-score of T-score = 70 has “moderate” effect size associated with a DLRpositive of 6.2
Center for Epidemiological Studies Depression Scale for Children (CES-DC).
This is a 20 item self-report scale. Included are items concerning depressed mood, feelings of guilt/worthlessness, helplessness, psychomotor retardation, loss of appetite, and sleep disturbance. Each item is rated on a four-point Likert scale. Unlike the depression scales listed above, this one uses a clinical sample for comparison. Respondents are compared with youngsters who have been diagnosed with major depression or dysthymia (persistent depressive disorder). Online scoring appears to offer a free option for up to 40 assessments per month. It is not clear that there is a test manual for the CES-DC.
Anxiety Scales
Like depression, anxiety seems to be commonplace among children seen by school psychologists (approximately 7.2% of youth have been diagnosed, according to the CDC https://www.cdc.gov/childrensmentalhealth/features/anxiety-depression-children.html[retrieved September 7, 2020]). Consequently, narrowband scales can help rule in or rule out the existence of such problems. The scales can also, at times, clarify the nature of a particular child’s anxiety. Like with narrowband depression scales, narrowband anxiety scales sometimes springboard the interview process. For reasons equivalent to depression scales, anxiety scales require a self-report option if they are to capture student’s private feelings and thoughts. Table 7.3 summarizes some of these scales.
Table 7.3 Some Narrowband Anxiety Scales |
|||
| Publisher | Age Range | Nature | Standardization Sample |
|
Revised Children’s Manifest Anxiety Scale |
|||
| Western Psychological Services |
6-19 years |
49-item self-report | Representative youth |
|
Multidimensional Anxiety Scale for Children-2 (2013) |
|||
| Multi-Health Systems |
8-19 years |
|
Representative youth |
Revised Children’s Manifest Anxiety Scale-2 (RCMAS-2)
The RCMAS-2 is made up of 49 yes/no items and is suited for youth 6 to 19 years (Reynolds & Richmond, 2008). Besides providing a composite score, the RCMAS-2 covers the dimensions of physiological anxiety, social anxiety, and worry. There are also two defensiveness factors designed to ascertain validity and response set. Factor analysis (Lowe, 2014) suggests that five factors, rather than the manual-listed three, might best characterize students’ responses. Lowe also concluded that the scale possessed a number of positive psychometric properties. This prompted her to call it a potential “gold standard” for measuring children’s anxiety (Lowe, 2014).
Multidimensional Anxiety Scale for Children-2 (MASC-2)
The MASC-2, designed for youth 8 to 19 years, reports T-scores for a Total Score (composite) as well as several narrower dimensions (March, 2013). These are: Separation Anxiety/Phobias, Generalized Anxiety Disorder Index, Social Anxiety, Humiliation/Rejection, Performance Fears, Obsessions and Compulsions, Physical Symptoms, Panic, Tense/Restless, and Harm Avoidance. For the fine-grained dimensions, however, there are relatively few items, ranging from 8 (concerning Harm Avoidance) to 12 (concerning Physical Symptoms). Self-report and parent-report versions use the same items. Although discriminate validity was considered in the manual, no information on sensitivity or specificity per se seems to be included. Thus, DLR calculations are not supported by the manual’s information.
Also, pertinent to making empirically-supported diagnostic conclusions is the MASC-2’s manual inclusion of an “Anxiety Probability Index.” This index “estimates a youth’s chance of having at least one anxiety disorder based on his/her profile elevations on the MASC-2 Anxiety scales…” (March, 2013, p. 25). School psychologists who reviewed the MASC-2 praised this feature (Fraccaro, Stelnicki & Nordstokke, 2015). The critical reader, however, may wonder how a probability index can be calculated without pretest (i.e., base rate information). As seen in Chapter 2, site-specific statistics (i.e., local base rate data) would necessarily be needed to calculate a posttest probability for any particular scale. Perhaps in referring to use of the Anxiety Probability Index the test author is actually addressing the probability of various MASC-2 scale elevations relative to other MASC-2 scores. This is unclear.
There is also post-publication research to consider. Wei and colleagues (2014) found that both parent and self-report MASC-2 scores independently contributed to accurate diagnoses, but the researchers also detected relatively low agreement between parents’ ratings and youngsters’ self-ratings. Inter-rater disagreement was common. Another finding from this study was that there were relatively few “pure” cases comprised of a single type of anxiety. Favorably, the researchers indicated good diagnostic utility arose from the use of the MASC-2. Even so, this article provided no tangible sensitivity and specificity values.
Obsessive-Compulsive Disorder (OCD) Scales
When there are ongoing OCD possibilities after other assessment information has been collected and interpreted, then a narrowband rating scale may be appropriate. To this end, the Obsessive Compulsive Inventory-Revised and the Child Yale-Brown Obsessive-Compulsive Scale, two popular childhood OCD options, were reviewed by Uher, Heyman, Turner and Shafran (2008). Table 7.4 provides some facts about both of these scales.
Table 7.4 Some Narrowband Obsessive-Compulsive Disorder (OCD) Scales |
|||
|
Publisher |
Age Range |
Nature |
Standardization Sample |
|
Obsessive Compulsive Inventory-Revised |
|||
| NovoPsych |
7-17 years |
|
Unclear |
|
Child Yale-Brown Obsessive-Compulsive Scale |
|||
| NovoPsych |
Unclear |
Semi-structured interview of child
|
Unclear |
Obsessional Compulsive Inventory-Revised (CHOCI-R)
The CHOCI-R (Shafran et al., 2003) provides one form to be completed by the child (i.e., a self-rating) and a second for structured interviewing. Each is comprised of 32-items addressing compulsions in one set of questions and another 32-items addressing obsessions in another set of questions. There is also extensive coverage of impairments related to obsessions and compulsions. In a study of 285 children and adolescents with OCD, the CHOCI-R was more effective at making discriminations at the mild to moderate range of OCD problems, whereas the CY-BOCS (see immediately below) was better at the severe end (Uher, Heyman, Turner & Shafran, 2008). Regrettably, clinical utility statistics were not located for the CHOCI-R.
Child Yale-Brown Obsessive-Compulsive Scale
CY-BOCS (Scahill et al., 1997) is actually a semi-structured interview technique but it contains elements reminiscent of rating scales. For example, there are checklists comprising both compulsion items and obsession items and each item is scored on a 5-point Likert scale. Unfortunately for those seeking an off-the-shelf tool to meet an immediate need, the CY-BOCS requires prior training for correct administration. What’s more, administration time is often lengthy (at least 15 minutes to as many as 90 minutes). As might be expected, it has extensive coverage of OCD symptomology and symptom-related impairment. There is also at least some evidence of adequate reliability and satisfactory validity. Research shows that the CY-BOCS discriminates better than the CHOCI-R at the extreme end of the OCD continuum (Uher, Heyman, Turner & Shafran, 2008). However, this tool is unlikely to garner much school-based use in light of its training requirements and its burdensome administration time.
Post-traumatic Stress Disorder (PTSD) Scales and Considerations
It’s tempting to envision the HR process as fixed, invariant, and inflexible. But this represents faulty thinking. For example, just because narrowband scales often work (and are profitably included in Middle Stage E on the HR Worksheet) it is wrong to conclude that they always work. Let’s make things concrete by considering a case of potential PTSD and consideration of narrowband scale use. It involves a truly terrible instance of trauma coupled with the prospect that lingering reactions to it (i.e., symptoms of PTSD).
Judy was a 9-year-old who was riding with her mother, father, and 7-year-old sister in the family car when her life was unalterably changed. A single engine airplane lost control and plummeted to earth. Without warning, Judy’s mother and sister were killed, leaving Judy and her father trapped in the vehicle until they could be extracted by the jaws of life. Now age 12 years, Judy presents as anxious and depressed. She was referred to the school psychologist for both learning and emotional problems. A review of the school districts standard form entitled Health, Developmental and Social History quickly revealed her history of trauma. Broadband rating scales from teacher, parent and Judy herself suggested possible anxiety and depression. Under these circumstances, might use of a standardized PTSD rating scale be advisable?
Well, there are clinical instruments (i.e., narrowband scales) that might be used with Judy. Consider the Child PTSD Symptoms Scale (CPSS; Foa, Johnson, Feeny & Treadwell, 2001). It comprises 26 self-report items based on DSM criteria. Items are distributed across the traumatic event itself, PTSD symptomology that might stem from the trauma, and PTSD-related functional impairments. The CPSS has been translated into Spanish (although Judy is an English speaker). There is even some evidence of satisfactory reliability (i.e., CPSS scale and rater agreement) as well as concerning convergent validity (Gillihan, Aderka, Conklin, Capaldi & Foa, 2013). And Judy’s school psychologist might conclude that like other narrowband scales, the CPSS may save school psychologists time by circumventing the requirement for detailed interviewing. Or, alternatively, some school psychologists doubt their own ability to conduct a competent trauma-related interview. Thus, the CPSS might seem appealing. Finally, and happily, the CPSS is also available for free at the following website: https://www.aacap.org/App_Themes/AACAP/docs/resource_centers/resources/misc/child_ptsd_symptom_scale.pdf
But school psychologists confronted with cases like Judy might be well advised to slow down and consider their best course of action. In this light, consider the following assertion: “Given that trauma exposure can be a sensitive or distressing topic for youth and parents, it is important to carefully consider how and when such questions should be asked. In most assessment situations, it is generally best to allow children and parents time to become comfortable with the assessment situation before broaching the topic of trauma” (LaGreca & Danzi, 2020, p. 423). Consequently, merely downloading a CPSS record form, printing it and then handing it to Judy can prove unwise. Much of the problem may be that the school psychologist is working without a roadmap unless she has conducted a skilled interview with Judy’s father after she became aware of the trauma history. Especially risky would be proceeding with a rating scale without knowing how Judy has already processed these events, whether she has received treatment associated with them or if her father himself experiences symptoms of PTSD capable of coloring his perceptions of his daughter’s situation. In light of these uncertainties, various items on scales like the CPSS might prove distressing. If poorly managed, they might even be counterproductive. For example, the CPSS starts with an open-ended question asking for a description of the traumatic event. This is followed by individual items asking directly about the occurrence of unwanted thoughts or images. Later there is a question about nightmares, followed by a question about event-related fear, guilt, anger, etc. There is a question about a bleak outlook for the future.
All of this seems to beg for careful consideration before straightforward use of a rating scale. When a situation proves especially challenging (like Judy’s) or when school psychologists is just starting their careers, then additional steps might be needed. Examples are including a more experience colleague in the assessment process (e.g., including sitting in on an interview) or concrete advice about aspects of practice (e.g., roleplaying about how the topic is broached with the student) and if (how) objective rating scales might be introduced. None of this is meant to argue that these topics should go unaddressed. Furthermore, as you have already learned, structured approaches that include all necessary items (akin to a checklist) are preferrable to haphazard approaches where important topics might be overlooked. Instead, it is merely contended here that mechanical, pro forma distribution of trauma or PTSD forms might need to be avoided (see Chapter 9 regarding routine and focused interviewing on this and related topics).
Social Skills, Strengths, and Competency Scales
Especially regarding intervention planning, it helps to know about things that a student does well. Furthermore, when providing parents with feedback, there is a risk to overfocus on psychopathology. Consequently, finding and quantifying things that students might do well or positive attributes that they possess can facilitate a balanced meeting with parents (see Chapter 13). Some examples follow of assessment tools that do not concentrate on problems (weaknesses) and that might detect important student strengths.
Social Skills Improvement System-Rating Scale (SSIS-RS)
SSIS-RS (Gresham & Elliot, 2008) is suited for students grade pre-K through 12, with teacher, parent and self-rating options available (the latter for children age 8 years and older). There are three broad scales, each with sub-elements (Social Skills, Problem Behaviors and Academic Competence). The first, Social Skills, is most relevant to the current chapter’s content. The second, Problem Behaviors, is in some ways reminiscent of a broadband scale (and is not covered in this book). The third, Academic Competence, may also provide valuable and unique information (it is addressed below). The following dimensions are found within Social Skills:
- Cooperation
- Assertion
- Responsibility
- Self-control
- Communication
- Teacher
- Empathy
- Engagement
A total social skills score (mean = 100; standard deviation = 15) is also provided. Regarding Social Skills, interpretations are presumably largely dimensional. In other words, one is not trying to make a diagnosis. Classification validity is, thus, not relevant. A third aspect of the SSIS-SR, Academic Competence, has 7 items completed by a classroom teacher. This involves rating student’s competence (e.g., academic subject areas, parental support). When school psychologists find well-developed social skills or other noteworthy competencies, they can record them on page 9 of the HR Worksheet under “strengths and support.” More uses of the SSIS-SR can be found in Gresham and Elliot (2014).
Devereux Strengths Assessment (DESSA)
The DESSA is a 72-item instrument that provides norm-referenced scores on a number of dimensions (LeBuffe, Shapiro & Naglieri, 2009). These dimensions are envisioned to serve a student as protective factors. The DESSA can be completed by teachers or parents for students K-8. T-scores are reported on the following dimensions:
- Self-awareness
- Social-awareness
- Self-management
- Goal-directed behavior
- Relationship skills
- Personal responsibility
- Decision making
- Optimistic thinking
There is also a composite score. Much as you have learned from your review of other instruments, the DESSA is to be interpreted sequentially. In other words, school psychologists would first examine the composite score, followed by each of the eight dimensions listed above before turning to individual item scrutiny.
Resources and Tools that You Might Consider
You may now have some idea about constructing your own tool kit, although this book’s focus is on how to use various tools rather than how to select among them. Nonetheless, it is worth considering a few things about narrowband scales. Included below are two websites that include information about narrowband scales. A third section below concerns narrowband tools that school psychologists routinely use.
Free, Online Resource from Evidence-based Assessment Site
A practice entitled evidence-based assessment (EBA) has recently appeared. An especially ardent champion of EBA is Eric Youngstrom, a clinical psychologist at the University of North Carolina. EBA, besides insistence on objective information found in the manuals of assessment instruments (plus in post-publication research), matches many concepts found in this text. For example, EBA emphasizes changing probability as additional assessment information is collected (including use of nomograms), concern with local base rates, quantifying a student’s risk factors, and employing objective behavioral rating scales completed by several informants (Youngstrom & Van Meter, 2016). But much of EBA is aimed for clinic practice, where the end goal is a decision about whether to treat, how to treat, and how intensively to treat. Thus, clinic-centered EBA is not identical with school-based assessment. Nonetheless, all diagnosticians can learn much from the tenets of EBA. Happily, Youngstrom has made provisions to share information about childhood EBA with all practitioners via a public website. Especially relevant to this chapter’s content is a portion of that website entitled “Which Questionnaire Should I Use?” Within most of the topic areas listed below, one finds various narrowband scales. Some can be downloaded for use in pdfs form via the website. Topic areas are as follows:
- ADHD
- anxiety
- autism
- bipolar disorder
- depression
- eating disorders
- overall mental health
- OCD
- personality disorders
- PTSD/trauma
- sleep
- substance use
- suicide
- tic disorders
Here is the link: https://en.m.wikiversity.org/wiki/Evidence-based_assessment
Free, Online Resource from the American Psychiatric Association
There is another source of narrowband rating scales, although some professionals might consider them to be structured interview techniques rather than rating scales per se. According to the algorithm accompanying the scales, each is used for follow-up purposes if a child endorses critical items in a so called “cross-cutting symptom measure.” One or more of these scales may be helpful in schools, especially for school psychologists without access to commercially available narrowband rating scales. Although psychometric evidence is absent for some of these scales, others do possess information about standard error of measurement and afford a means to calculate derived scores. Many contain listed cut-score values. Each narrowband option, minimally, allows school psychologists to delve into a discrete domain and then review item-level responses. The narrowband dimensions covered, typically for children 6 to 17 years, include the following:
- somatic symptoms
- sleep disturbance
- inattention
- depression
- anger
- irritability
- mania
- anxiety
- substance abuse
These are available, free of charge, at the following link: https://www.psychiatry.org/psychiatrists/practice/dsm/educational-resources/assessment-measures
School Psychologists’ Narrowband Preferences
Now that you have gained familiarity with various narrowband tools, you might want to take a systematic look at what your school psychology colleagues say they use. Table 7.5 is based on a large, representative national sampling of school psychologists’ (Benson et al, 2019). You have already seen (in Chapter 5) that the BASC-3 TRS is the single most commonly used of all tests based on this survey. And, the BASC-3 PRS is number three (if you are curious about number two, it’s the WISC-5). Because this book is not intended to conduct a systematic, side-by-side comparison of instruments, this list might help you decide which instruments to consider for your own use. Remember, however, that popularity is not synonymous with technical quality. Nonetheless, this list is worth considering.
Table 7.5 School Psychologists’ Ratings of Narrowband Scales They Use |
|||
|
Category measured |
Instrument’s title |
Ranking by school psychologists† |
Chapter covered in this book |
| ADHD/executive function | BRIEF-2 teacher (24) | 24th | 12 |
| ADHD/executive function | BRIEF-2 parent (28) | 28th | 12 |
| ADHD/executive function | BRIEF-2 self-report (36) | 36th | 12 |
| ADHD | ADHD-5 Rating Scale-School Version | 91st | 12 |
| ADHD | ADHD-5 Rating Scale-Home Version (97) | 97th | 12 |
| Anxiety | Revised Children’s Manifest Anxiety Scales-2 | 64th | 7 |
| Anxiety | Multi-dimensional Anxiety Scale for Children-2 | 72nd | 7 |
| Anxiety | Beck Anxiety Inventory | 115th | 7 |
| Autism | Gilliam Autism Rating Scale | 47th | 11 |
| Autism | Gilliam Aspergers Disorder Scale | 107th | 11 |
| Depression | Children’s Depression Inventory | 53rd | 7 |
| Depression | Reynolds Adolescent Depression Scale-2 | 98th | 7 |
| Depression | Beck Depression Inventory-2 | 103rd | 7 |
| Depression | Reynolds Childhood Depression Scale-2 | 112th | 7 |
| Strengths | Devereux Student Strengths Assessment | 135th | 7 |
| †Rankings concern all instruments, including those that are not social-emotional in nature. Source: Benson et al, 2019 | |||
The Case of Breanna
Breanna Taylor is an eight-year-old second-grade girl referred for evaluation by her classroom teacher, Ms. Grant. The referral question concerned whether there is an emotional problem that might merit special education and related services. Ms. Grant has had several discussions with Breanna’s parents regarding Breanna’s social isolation and apparent unhappy appearance. Breanna’s mother, who is a practicing attorney, insisted that she would not permit her daughter to be evaluated for special education services. Subsequently, Mrs. Taylor consulted the internet and her own legal library to inform herself about the array of school entitlement programs that might pertain to her daughter. After doing so, she consented for an evaluation to determine if Breanna actually had a diagnosable problem. Mrs. Taylor eventually stated that she might consider a 504 Plan.
Breanna’s school psychologist thus launched a comprehensive evaluation. It consisted of review of developmental and social history as completed by parents, interview with Ms. Grant (Breanna’s teacher), classroom and playground observation of Breanna, and broadband rating scales (BASC-3) completed by Ms. Grant and by Mr. and Mrs. Taylor. Breanna school psychologist used the HR Worksheet to generate hypotheses and to synthesize information as she worked.
By the time the middle stages of the evaluation were reached, it seemed clear to Breanna’s school psychologist that there were genuine social-emotional difficulties impacting the girl’s quality of life. A co-occurring speech-language evaluation rule out general language problems. Interestingly, Breanna’s potential social-emotional difficulties notwithstanding, she was an outstanding student who completed all of her work, quickly grasp new concepts, and performed well on high-stakes reading, arithmetic, and written expression assessments. Breanna’s BASC-3 scores appear in Table 7.6.
Table 7.6 Breanna’s Broadband Scores |
||
|
Behavior Assessment System for Children-3
|
||
|
Parent-Mr. & Mrs. Taylor |
Teacher-Ms. Grant |
|
| F Index | Acceptable | Acceptable |
| Response Pattern | Acceptable | Acceptable |
| Consistency | Acceptable | Acceptable |
| Hyperactivity | 47 | 64 |
| Aggression | 51 | 66 |
| Conduct Problems | 53 | 52 |
| Externalizing Problems | 50 | 62 |
| Anxiety | 55 | 70 |
| Depression | 64 | 90 |
| Somatization | 58 | 44 |
| Internalizing Problems | 61 | 72 |
| Attention Problems | 59 | 54 |
| Atypicality | 62 | 56 |
| Withdrawal | 73 | 80 |
| Behavioral Symptom Index | 62 | 74 |
| Adaptability | 27 | 28 |
| Social Skills | 34 | 30 |
| Functional Communication | 36 | 35 |
| Leadership | 33 | 37 |
| Study Skills | — | 47 |
| Adaptive Skills | 32 | 33 |
| Activities of Daily Living | 40 | — |
When provided preliminary feedback, Mr. and Mrs. Taylor viewed their daughter’s problems as circumscribed (a fact reflected in only slight BASC-3 Internalizing elevations) and not very educationally consequential. They recognized shyness, reticence, discouragement and self-recrimination coupled with a “gloomy disposition.” Still, they remained unconvinced about the prospect of a documentable mental health problem.
At this point, Breanna’s school psychologist suggested a diagnostic interview with Breanna herself. The idea was that Breanna’s problems were internalizing and that interviewing was especially well suited to detecting them. Mr. and Mrs. Taylor balked at this suggestion. They were particularly worried about subjectivity and feared that pre-existing biases might be used to mischaracterize their daughter. As a compromise, Mr. and Mrs. Taylor consented to use of narrowband ratings. Once again, however, there were restrictions. Mrs. Taylor’s stated the following, “Pick out the number one problem that you think is present and we will allow Breanna to complete a rating scale concerning that problem, but concerning only that problem.” Breanna’s school psychologists, consequently, zeroed in on depression as her primary diagnostic hypothesis. Consequently, the Reynolds Child Depression Scale-2 was selected for use. Breanna scores were as follows:
- Total T-score = 80
- Emotional Problems T-score = 72
- Negative Mood/Physical Symptoms T-score = 74
- Negative Self-esteem T- score = 58
- Functional Problems T-score = 72
- Ineffectiveness T-score = 81
- Interpersonal Problems T-score = 70
Updated results were then discussed with Breanna’s parents. But for obvious reasons, the narrowband depression scale results warranted particular consideration and painstaking scrutiny. In fact, when the school psychologist went through each Reynolds Childhood Depression Scale-2 subscale result one-by-one Breanna’s parents seemed incrementally persuaded about their daughter’s apparent depression. A planful, well-organized presentation of each piece of assessment information, its rationale, and case-specific relevance is a strategy known as a “bottom-up” explanation (Wodrich & Schmitt, 2006). You will see more about this approach in Chapter 13. The bottom up approach is deemed especially helpful for resistant or detail-oriented parents who need to be convinced about the veracity of assessment findings. In fact, Mr. and Mrs. Taylor ultimately consented to a diagnostic interview to add clarity to their daughter’s situation. Most importantly, they eventually agreed to creation of a 504 Plan.
Summary
Following collection of background information, completion of parent and teacher interview, broadband rating scales, classroom observation (and often a student interview) one or more strong hypotheses often emerges. The school psychologist’s challenge is to confirm or disconfirm these hypotheses. Narrowband rating scales can often help. Narrowly focused instruments tap just one domain. School psychologists then typically select just one or two tools to investigate topics with special relevance. Because all of their items are concentrated on just a single dimension, narrowband tools often enjoy full construct representation and favorable reliability. In this chapter, tools concerning mostly internalizing psychopathology are reviewed; other chapters cover narrowband scales addressing autism and ADHD.